


文章目录
展开为什么做监控
企业中:
1.系统的监控:实际上是对系统不间断的实时监控
2.实时反馈系统当前状态:我们监控某个硬件、或者某个系统,都是需要能实时看到当前系统的状态,是正常、异常、或者故障。
3.保证服务可靠性安全性:我们监控的目的就是要保证系统、服务、业务正常运行
4.保证业务持续稳定运行:如果我们的监控做得很完善,即使出现故障,能第一时间接收到故障报警,在第一时间处理解决,从而保证业务持续性的稳定运行。(往往,第一时间知道业务宕机的都是用户)
监控软件
-
CACTI 网络监控
-
Nagios
-
Zabbix 分布式监控系统
-
open-falcon
-
普罗米修斯 promtheus
-
天兔
面试常问问题
面试官:你们公司监控是如何做的?
回答:监控软件我们使用的是zabbix,我们监控在不同的维度
-
硬件层面 Dell R710 R720 R730
- 如果不使用dell的idrac那就使用zabbix的
IPMI接口监控硬件
1)CPU温度,
2)风扇转速,
3)磁盘是否损坏,
4)CMOS电池电量
5)内存是否损坏.....
- 云主机,不需要说硬件层,一般云主机都自带,硬件监控
- 如果不使用dell的idrac那就使用zabbix的
-
系统层面
- 内存
- 内存使用率
- 缓冲区
- 缓存区
- 堆
- 栈
- CPU
- CPU使用率
- CPU的负载
- CPU核心数线程
- 磁盘
- 磁盘使用率
- 磁盘大小
- 磁盘IO
-
网络层面
- 网卡接口
- 网卡流量
- 交换机
- 路由器
-
应用层面
- nginx
- 进程
- 端口
- 网站访问
- MySQL
- 进程
- 端口
- 主从复制
- SQL读写速率
- 是否可以登录
- InnoDB
- 缓存
- 表空间
- 慢查询
- tomcat
- JMX
- 老年代
- 新生代
- 永久代
- 垃圾回收
- full-gc
- 进程
- 端口
- 网站是否可以访问
- redis
- 进程
- 端口
- 连接状态
- 主从复制 info
- 集群状态
- key,缓存
- 缓存穿透
- 缓存击穿
- 缓存雪崩
- NFS、GFS(集群式的NFS)、Ceph、FastDFS
- 进程
- 挂载情况
- 数据同步
- PHP
- 进程
- 端口(socket)
- 网站访问情况
- php info
- ....
-
业务层面
- 代码
- 接口
单机监控命令
CPU监控命令
## w:用来查看登录者的信息及行为
[root@zabbix-server ~]# w             负载
 15:50:30 up  2:22,  1 user,  load average: 0.00, 0.01, 0.05
USER     TTY      FROM             LOGIN@   IDLE   JCPU   PCPU WHAT
root     pts/1    10.0.0.1         15:36    6.00s  0.01s  0.00s w

## top:常用的性能分析工具,能够实时显示系统中各个进程的资源占用状况,类似于Windows的任务管理器
## 只显示一次资源使用状况
[root@zabbix-server ~]# top -n 1

## htop:美化的top 可以用鼠标点的终端
[root@zabbix-server ~]# yum install -y htop
[root@zabbix-server ~]# htop
## w:用来查看登录者的信息及行为
[root@zabbix-server ~]# w 负载
15:50:30 up 2:22, 1 user, load average: 0.00, 0.01, 0.05
USER TTY FROM LOGIN@ IDLE JCPU PCPU WHAT
root pts/1 10.0.0.1 15:36 6.00s 0.01s 0.00s w
## top:常用的性能分析工具,能够实时显示系统中各个进程的资源占用状况,类似于Windows的任务管理器
## 只显示一次资源使用状况
[root@zabbix-server ~]# top -n 1
## htop:美化的top 可以用鼠标点的终端
[root@zabbix-server ~]# yum install -y htop
[root@zabbix-server ~]# htop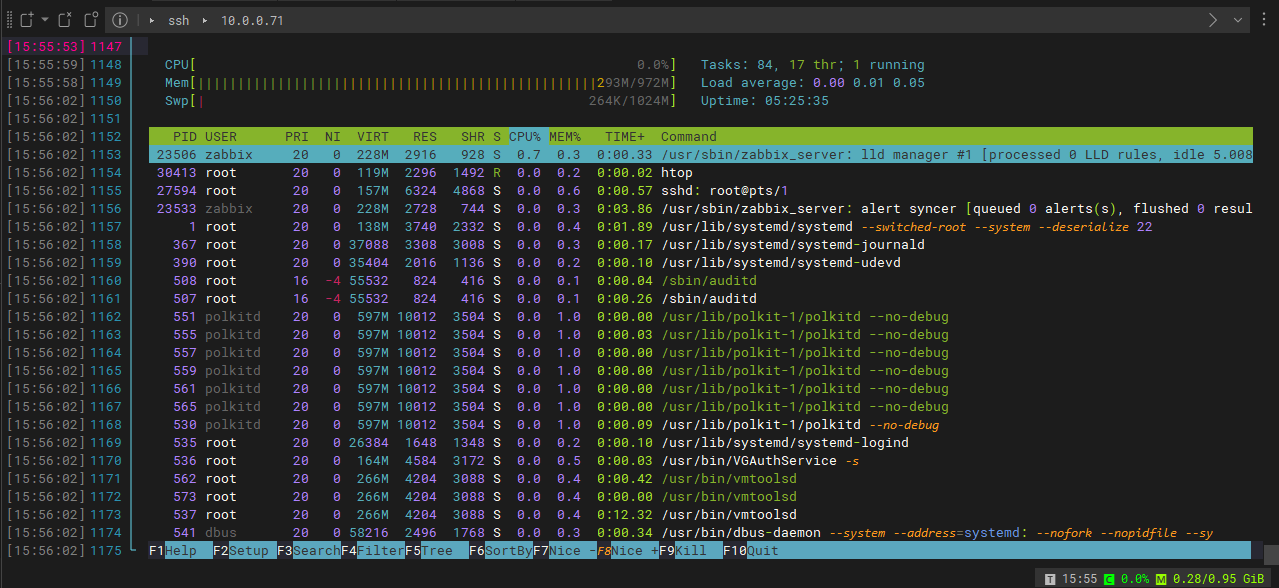
## glances:性能监控 可以监视 CPU,平均负载,内存,网络流量,磁盘 I/O,其他处理器和文件系统 空间利用情况
[root@zabbix-server ~]# yum install -y glances
[root@zabbix-server ~]# glances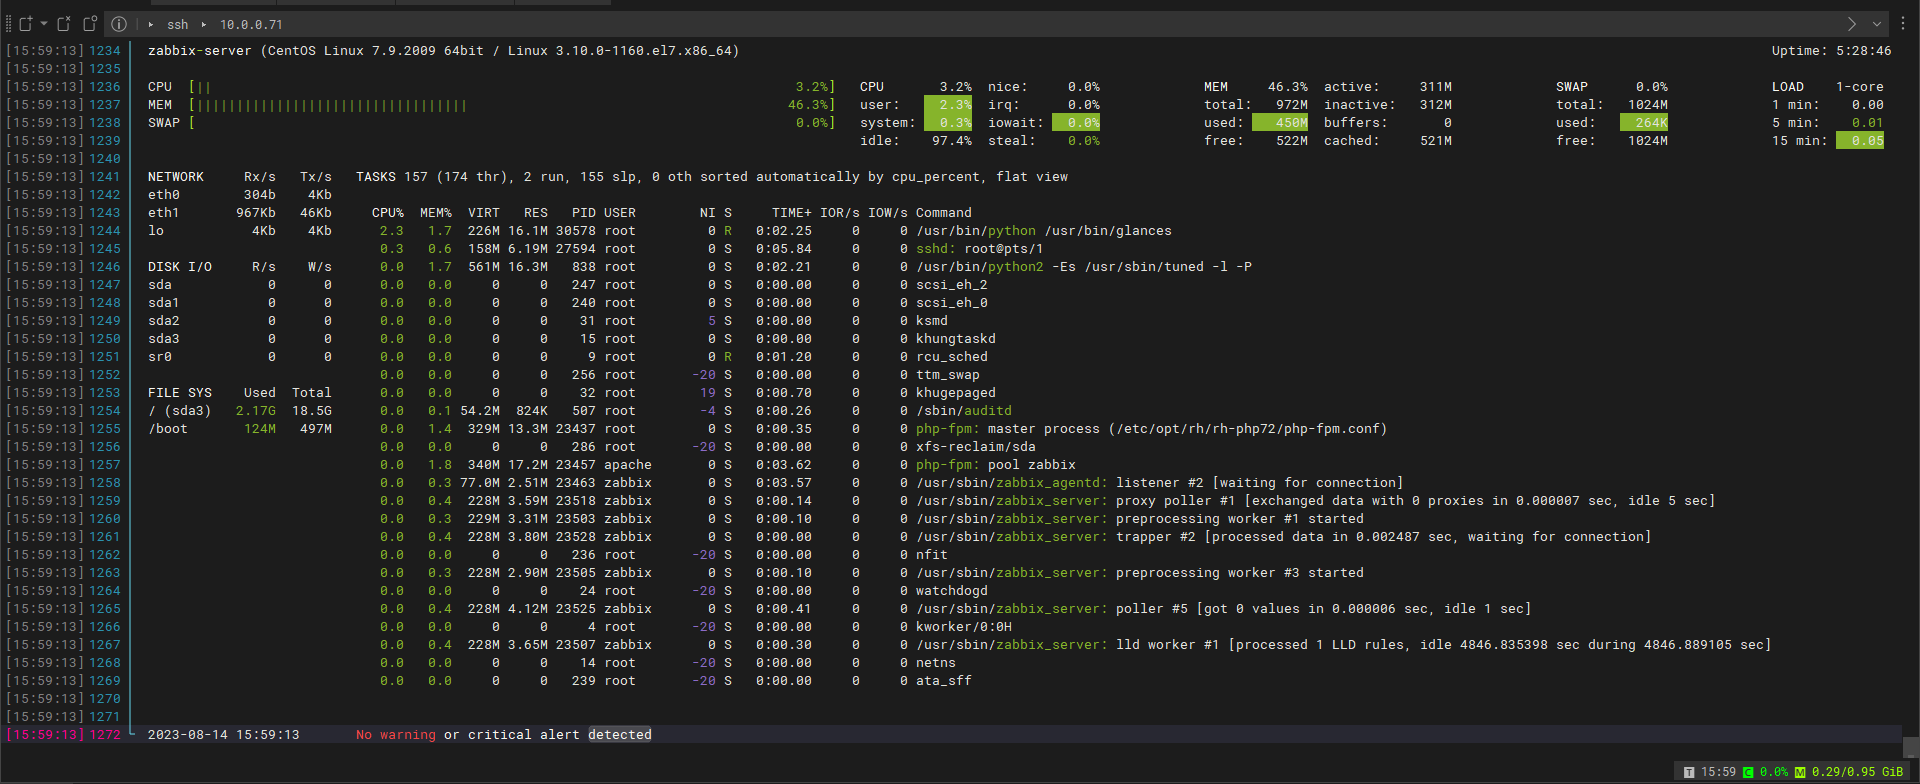
## uptime:主要用于获取主机运行时间和查询linux系统负载等信息
 当前时间 系统运行时间 目前登陆用户 系统在过去的1分钟、5分钟和15分钟内的平均负载
 [root@zabbix-server ~]# uptime
 16:02:08 up  5:31,  2 users,  load average: 0.11, 0.07, 0.06
 当前时间 系统运行时间 登陆用户数 系统在过去的1分钟、5分钟和15分钟内的平均负载

## lscpu:查看CPU的详细信息 从sysfs、/proc/cpuinfo、或者某些适用于特定架构的库中收集数据。命令的输出会以人类易读的方式展示如下信息:cpu、线程、核心、插槽和Non-Uniform MemoryAccess (NUMA)节点的数量,也有cpu共享缓存,cpu的族号,运行模式,处理指令的速度,大小端,步进等信息
[root@zabbix-server ~]# lscpu
Architecture:          x86_64
CPU op-mode(s):        32-bit, 64-bit
Byte Order:            Little Endian
CPU(s):                1
On-line CPU(s) list:   0
Thread(s) per core:    1
Core(s) per socket:    1
Socket(s):             1
NUMA node(s):          1
Vendor ID:             GenuineIntel
CPU family:            6
Model:                 158
Model name:            Intel(R) Core(TM) i7-9750H CPU @ 2.60GHz
Stepping:              13
CPU MHz:               2592.000
BogoMIPS:              5184.00
Hypervisor vendor:     VMware
Virtualization type:   full
L1d cache:             32K
L1i cache:             32K
L2 cache:              256K
L3 cache:              12288K
NUMA node0 CPU(s):     0
Flags:                 fpu vme de pse tsc msr pae mce cx8 apic sep mtrr pge mca cmov pat pse36 clflush mmx fxsr sse sse2 ss syscall nx pdpe1gb rdtscp lm constant_tsc arch_perfmon nopl xtopology tsc_reliable nonstop_tsc eagerfpu pni pclmulqdq ssse3 fma cx16 pcid sse4_1 sse4_2 x2apic movbe popcnt tsc_deadline_timer aes xsave avx f16c rdrand hypervisor lahf_lm abm 3dnowprefetch invpcid_single ssbd ibrs ibpb stibp ibrs_enhanced fsgsbase tsc_adjust bmi1 avx2 smep bmi2 invpcid rdseed adx smap clflushopt xsaveopt xsavec xgetbv1 arat md_clear spec_ctrl intel_stibp flush_l1d arch_capabilities

## lscpu的第二种看法
[root@zabbix-server ~]# cat /proc/cpuinfo
processor       : 0
vendor_id       : GenuineIntel
cpu family      : 6
model           : 158
model name      : Intel(R) Core(TM) i7-9750H CPU @ 2.60GHz
stepping        : 13
microcode       : 0xde
cpu MHz         : 2592.000
cache size      : 12288 KB
physical id     : 0
siblings        : 1
core id         : 0
cpu cores       : 1
apicid          : 0
initial apicid  : 0
fpu             : yes
fpu_exception   : yes
cpuid level     : 22
wp              : yes
flags           : fpu vme de pse tsc msr pae mce cx8 apic sep mtrr pge mca cmov pat pse36 clflush mmx fxsr sse sse2 ss syscall nx pdpe1gb rdtscp lm constant_tsc arch_perfmon nopl xtopology tsc_reliable nonstop_tsc eagerfpu pni pclmulqdq ssse3 fma cx16 pcid sse4_1 sse4_2 x2apic movbe popcnt tsc_deadline_timer aes xsave avx f16c rdrand hypervisor lahf_lm abm 3dnowprefetch invpcid_single ssbd ibrs ibpb stibp ibrs_enhanced fsgsbase tsc_adjust bmi1 avx2 smep bmi2 invpcid rdseed adx smap clflushopt xsaveopt xsavec xgetbv1 arat md_clear spec_ctrl intel_stibp flush_l1d arch_capabilities
bogomips        : 5184.00
clflush size    : 64
cache_alignment : 64
address sizes   : 45 bits physical, 48 bits virtual
power management:
不管用什么命令监控,查看CPU,我们都必须了解,系统的用户态和内和态。
us: 用户态     跟用户的操作有关35%
sy: 内和态     跟内核的处理有关65%
id: CPU空闲

## 当我们执行一个命令的时候,很快能出来结果,但是有多少人知道,这个很快,他都占用了哪些时间呢?
# 使用time去看 命令的执行时间
[root@zabbix-server ~]# time ls
anaconda-ks.cfg  main.sh

real    0m0.001s  // 真实的执行时间
user    0m0.001s  // 用户态的执行时间
sys     0m0.000s  // 内核态的执行时间
监控内存
## free:可以显示当前系统未使用的和已使用的内存数目,还可以显示被内核使用的内存缓冲区。
[root@zabbix-server ~]# free
              total        used        free      shared  buff/cache   available
Mem:         995676      290020      171492        9988      534164      544548
Swap:       1048572         264     1048308

total:总计物理内存的大小。
used:已使用多少。
free:可用内存多少。
Shared:多个进程共享的内存总额。
Buffers/cached:磁盘缓存的大小。
available:可用内存

# -g选项:以G为单位显示
[root@zabbix-server ~]# free -g
              total        used        free      shared  buff/cache   available
Mem:              0           0           0           0           0           0
Swap:             0           0           0

# -m选项:以M为单位显示
[root@zabbix-server ~]# free -m
              total        used        free      shared  buff/cache   available
Mem:            972         283         167           9         521         531
Swap:          1023           0        1023

# -h选项:以人类读得懂的方式显示
[root@zabbix-server ~]# free -h
              total        used        free      shared  buff/cache   available
Mem:           972M        283M        167M        9.8M        521M        531M
Swap:          1.0G        264K        1.0G

## top  这三个也可以看到内存
## htop
## glances

## lsmem:查看内容相关的信息
[root@zabbix-server ~]# lsmem
RANGE                                 SIZE  STATE REMOVABLE BLOCK
0x0000000000000000-0x000000003fffffff   1G online        no   0-7

Memory block size:       128M
Total online memory:       1G
Total offline memory:      0B

## cat /proc/meminfo:查看内容相关的更详细的信息(动态)
[root@zabbix-server ~]# cat /proc/meminfo
MemTotal:         995676 kB
MemFree:          171544 kB
MemAvailable:     544756 kB
Buffers:               0 kB
Cached:           487476 kB
SwapCached:           20 kB
Active:           309380 kB
Inactive:         319812 kB
Active(anon):      96640 kB
Inactive(anon):    55064 kB
Active(file):     212740 kB
Inactive(file):   264748 kB
Unevictable:           0 kB
Mlocked:               0 kB
SwapTotal:       1048572 kB
SwapFree:        1048308 kB
Dirty:                 8 kB
Writeback:             0 kB
AnonPages:        141728 kB
Mapped:            32940 kB
Shmem:              9988 kB
Slab:              91036 kB
SReclaimable:      46844 kB
SUnreclaim:        44192 kB
KernelStack:        4784 kB
PageTables:        20256 kB
NFS_Unstable:          0 kB
Bounce:                0 kB
WritebackTmp:          0 kB
CommitLimit:     1546408 kB
Committed_AS:     908768 kB
VmallocTotal:   34359738367 kB
VmallocUsed:      177324 kB
VmallocChunk:   34359310332 kB
Percpu:            22528 kB
HardwareCorrupted:     0 kB
AnonHugePages:     75776 kB
CmaTotal:              0 kB
CmaFree:               0 kB
HugePages_Total:       0
HugePages_Free:        0
HugePages_Rsvd:        0
HugePages_Surp:        0
Hugepagesize:       2048 kB
DirectMap4k:       63360 kB
DirectMap2M:      985088 kB
DirectMap1G:           0 kB
## free:可以显示当前系统未使用的和已使用的内存数目,还可以显示被内核使用的内存缓冲区。
[root@zabbix-server ~]# free
total used free shared buff/cache available
Mem: 995676 290020 171492 9988 534164 544548
Swap: 1048572 264 1048308
total:总计物理内存的大小。
used:已使用多少。
free:可用内存多少。
Shared:多个进程共享的内存总额。
Buffers/cached:磁盘缓存的大小。
available:可用内存
# -g选项:以G为单位显示
[root@zabbix-server ~]# free -g
total used free shared buff/cache available
Mem: 0 0 0 0 0 0
Swap: 0 0 0
# -m选项:以M为单位显示
[root@zabbix-server ~]# free -m
total used free shared buff/cache available
Mem: 972 283 167 9 521 531
Swap: 1023 0 1023
# -h选项:以人类读得懂的方式显示
[root@zabbix-server ~]# free -h
total used free shared buff/cache available
Mem: 972M 283M 167M 9.8M 521M 531M
Swap: 1.0G 264K 1.0G
## top 这三个也可以看到内存
## htop
## glances
## lsmem:查看内容相关的信息
[root@zabbix-server ~]# lsmem
RANGE SIZE STATE REMOVABLE BLOCK
0x0000000000000000-0x000000003fffffff 1G online no 0-7
Memory block size: 128M
Total online memory: 1G
Total offline memory: 0B
## cat /proc/meminfo:查看内容相关的更详细的信息(动态)
[root@zabbix-server ~]# cat /proc/meminfo
MemTotal: 995676 kB
MemFree: 171544 kB
MemAvailable: 544756 kB
Buffers: 0 kB
Cached: 487476 kB
SwapCached: 20 kB
Active: 309380 kB
Inactive: 319812 kB
Active(anon): 96640 kB
Inactive(anon): 55064 kB
Active(file): 212740 kB
Inactive(file): 264748 kB
Unevictable: 0 kB
Mlocked: 0 kB
SwapTotal: 1048572 kB
SwapFree: 1048308 kB
Dirty: 8 kB
Writeback: 0 kB
AnonPages: 141728 kB
Mapped: 32940 kB
Shmem: 9988 kB
Slab: 91036 kB
SReclaimable: 46844 kB
SUnreclaim: 44192 kB
KernelStack: 4784 kB
PageTables: 20256 kB
NFS_Unstable: 0 kB
Bounce: 0 kB
WritebackTmp: 0 kB
CommitLimit: 1546408 kB
Committed_AS: 908768 kB
VmallocTotal: 34359738367 kB
VmallocUsed: 177324 kB
VmallocChunk: 34359310332 kB
Percpu: 22528 kB
HardwareCorrupted: 0 kB
AnonHugePages: 75776 kB
CmaTotal: 0 kB
CmaFree: 0 kB
HugePages_Total: 0
HugePages_Free: 0
HugePages_Rsvd: 0
HugePages_Surp: 0
Hugepagesize: 2048 kB
DirectMap4k: 63360 kB
DirectMap2M: 985088 kB
DirectMap1G: 0 kB如何查看单个进程占用内存?
# 进程占用内存公式
      虚拟内存      总内存
pmem = VmRSS / MemTotal * 100

# 进程占用虚拟内存公式
process mem = 虚拟内存 / 总内存 * 100
python脚本获取进程使用内存情况
[root@zabbix-server ~]# cat mem.py
#!/usr/bin/env python
# _*_ coding:UTF-8 _*_
# 收集程序所占用的物理内存大小,占所有物理内存的比例
# Python: 2.7.6

import sys
import os
from subprocess import Popen,PIPE

def get_pid(program):
    '获取目标程序的PID列表'
    p = Popen(['pidof',program],stdout=PIPE,stderr=PIPE)
    pids,stderrput = p.communicate()
#     pids = p.stdout.read()  #这种方法也是可以的
#     这里也可以对stderrput来进行判断
    if pids:
        return pids.split()
    else:
        raise ValueError

def mem_calc(pids):
    '计算PIDs占用的内存大小'
    mem_total = 0
    for pid in pids:
        os.chdir('/proc/%s' % pid)
        with open('status') as fd:
            for line in fd:
                if line.startswith('VmRSS'):
                    mem = line.strip().split()[1]
                    mem_total += int(mem)
                    break
    return mem_total

def mem_percent(mem):
    '计算程序内存占用物理内存的百分比'
    with open('/proc/meminfo') as fd:
        for line in fd:
            if line.startswith('MemTotal'):
                total = line.strip().split()[1]
        percent = (float(mem)/int(total)) * 100
    return percent

def main():
    try:
        program = sys.argv[1]
        pids = get_pid(program)
    except IndexError as e:
        sys.exit('%s need a Program name ' % __file__)
    except ValueError as e:
        sys.exit('%s not a Process Name or not Start' % program )
    mem_total = mem_calc(pids)
    percent = mem_percent(mem_total)
    return program,mem_total,percent

if __name__ == '__main__':
    program,mem_total,mem_percent=main()
    print('进程名称:%s\n物理内存为:%s\n百分比为:%.2f%%'% (program,mem_total,mem_percent))

[root@zabbix-server ~]# python mem.py  zabbix_agentd
进程名称:zabbix_agentd
物理内存为:12332
百分比为:1.24%

[root@zabbix-server ~]# python mem.py  zabbix_server
进程名称:zabbix_server
物理内存为:115300
百分比为:11.58%

[root@zabbix-server ~]# python mem.py  httpd
进程名称:httpd
物理内存为:212148
百分比为:21.30%
监控磁盘命令
## df:检查文件系统的磁盘空间占用情况
# -i选项:显示每个磁盘的Inodes使用情况
[root@zabbix-server ~]# df -i
Filesystem      Inodes IUsed   IFree IUse% Mounted on
devtmpfs        121767   378  121389    1% /dev
tmpfs           124459     1  124458    1% /dev/shm
tmpfs           124459   720  123739    1% /run
tmpfs           124459    16  124443    1% /sys/fs/cgroup
/dev/sda3      9704960 41122 9663838    1% /
/dev/sda1       256000   326  255674    1% /boot
tmpfs           124459     1  124458    1% /run/user/0

# -h选项:显示没个磁盘block的使用情况
[root@zabbix-server ~]# df -h
Filesystem      Size  Used Avail Use% Mounted on
devtmpfs        476M     0  476M   0% /dev
tmpfs           487M     0  487M   0% /dev/shm
tmpfs           487M  7.7M  479M   2% /run
tmpfs           487M     0  487M   0% /sys/fs/cgroup
/dev/sda3        19G  2.2G   17G  12% /
/dev/sda1       497M  125M  373M  26% /boot
tmpfs            98M     0   98M   0% /run/user/0

# -ih选项:给Inodes加上单位
[root@zabbix-server ~]# df -ih
Filesystem     Inodes IUsed IFree IUse% Mounted on
devtmpfs         119K   378  119K    1% /dev
tmpfs            122K     1  122K    1% /dev/shm
tmpfs            122K   720  121K    1% /run
tmpfs            122K    16  122K    1% /sys/fs/cgroup
/dev/sda3        9.3M   41K  9.3M    1% /
/dev/sda1        250K   326  250K    1% /boot
tmpfs            122K     1  122K    1% /run/user/0

## iotop:查看进程对磁盘的使用情况,IO吞吐量情况
[root@zabbix-server ~]# iotop
[root@zabbix-server ~]# cat mem.py
#!/usr/bin/env python
# _*_ coding:UTF-8 _*_
# 收集程序所占用的物理内存大小,占所有物理内存的比例
# Python: 2.7.6
import sys
import os
from subprocess import Popen,PIPE
def get_pid(program):
'获取目标程序的PID列表'
p = Popen(['pidof',program],stdout=PIPE,stderr=PIPE)
pids,stderrput = p.communicate()
# pids = p.stdout.read() #这种方法也是可以的
# 这里也可以对stderrput来进行判断
if pids:
return pids.split()
else:
raise ValueError
def mem_calc(pids):
'计算PIDs占用的内存大小'
mem_total = 0
for pid in pids:
os.chdir('/proc/%s' % pid)
with open('status') as fd:
for line in fd:
if line.startswith('VmRSS'):
mem = line.strip().split()[1]
mem_total += int(mem)
break
return mem_total
def mem_percent(mem):
'计算程序内存占用物理内存的百分比'
with open('/proc/meminfo') as fd:
for line in fd:
if line.startswith('MemTotal'):
total = line.strip().split()[1]
percent = (float(mem)/int(total)) * 100
return percent
def main():
try:
program = sys.argv[1]
pids = get_pid(program)
except IndexError as e:
sys.exit('%s need a Program name ' % __file__)
except ValueError as e:
sys.exit('%s not a Process Name or not Start' % program )
mem_total = mem_calc(pids)
percent = mem_percent(mem_total)
return program,mem_total,percent
if __name__ == '__main__':
program,mem_total,mem_percent=main()
print('进程名称:%s\n物理内存为:%s\n百分比为:%.2f%%'% (program,mem_total,mem_percent))
[root@zabbix-server ~]# python mem.py zabbix_agentd
进程名称:zabbix_agentd
物理内存为:12332
百分比为:1.24%
[root@zabbix-server ~]# python mem.py zabbix_server
进程名称:zabbix_server
物理内存为:115300
百分比为:11.58%
[root@zabbix-server ~]# python mem.py httpd
进程名称:httpd
物理内存为:212148
百分比为:21.30%## df:检查文件系统的磁盘空间占用情况
# -i选项:显示每个磁盘的Inodes使用情况
[root@zabbix-server ~]# df -i
Filesystem Inodes IUsed IFree IUse% Mounted on
devtmpfs 121767 378 121389 1% /dev
tmpfs 124459 1 124458 1% /dev/shm
tmpfs 124459 720 123739 1% /run
tmpfs 124459 16 124443 1% /sys/fs/cgroup
/dev/sda3 9704960 41122 9663838 1% /
/dev/sda1 256000 326 255674 1% /boot
tmpfs 124459 1 124458 1% /run/user/0
# -h选项:显示没个磁盘block的使用情况
[root@zabbix-server ~]# df -h
Filesystem Size Used Avail Use% Mounted on
devtmpfs 476M 0 476M 0% /dev
tmpfs 487M 0 487M 0% /dev/shm
tmpfs 487M 7.7M 479M 2% /run
tmpfs 487M 0 487M 0% /sys/fs/cgroup
/dev/sda3 19G 2.2G 17G 12% /
/dev/sda1 497M 125M 373M 26% /boot
tmpfs 98M 0 98M 0% /run/user/0
# -ih选项:给Inodes加上单位
[root@zabbix-server ~]# df -ih
Filesystem Inodes IUsed IFree IUse% Mounted on
devtmpfs 119K 378 119K 1% /dev
tmpfs 122K 1 122K 1% /dev/shm
tmpfs 122K 720 121K 1% /run
tmpfs 122K 16 122K 1% /sys/fs/cgroup
/dev/sda3 9.3M 41K 9.3M 1% /
/dev/sda1 250K 326 250K 1% /boot
tmpfs 122K 1 122K 1% /run/user/0
## iotop:查看进程对磁盘的使用情况,IO吞吐量情况
[root@zabbix-server ~]# iotop 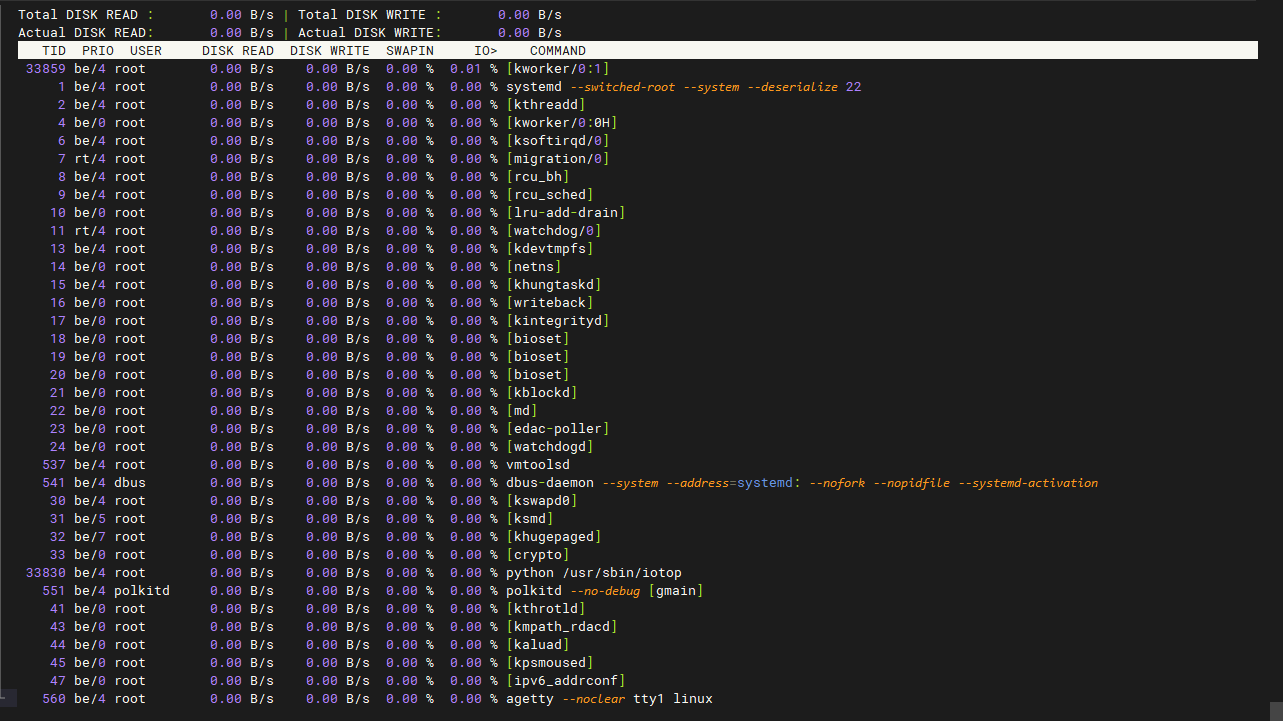
## iostat:查看磁盘的IO吞吐量
-d:指定多久出一次结果 单位是秒
-m:指定出几次结果
[root@zabbix-server ~]# iostat -dm 1 3
Linux 3.10.0-1160.el7.x86_64 (zabbix-server)    08/14/2023      _x86_64_        (1 CPU)

Device:            tps    MB_read/s    MB_wrtn/s    MB_read    MB_wrtn
sda               1.29         0.02         0.04        361        921
scd0              0.00         0.00         0.00          1          0

Device:            tps    MB_read/s    MB_wrtn/s    MB_read    MB_wrtn
sda               2.00         0.00         0.01          0          0
scd0              0.00         0.00         0.00          0          0

Device:            tps    MB_read/s    MB_wrtn/s    MB_read    MB_wrtn
sda               0.00         0.00         0.00          0          0
scd0              0.00         0.00         0.00          0          0

## dstat:可以实时的监控cpu、磁盘、网络、IO、内存等使用情况(动态)
[root@zabbix-server ~]# yum install -y dstat
[root@zabbix-server ~]# dstat -cdngy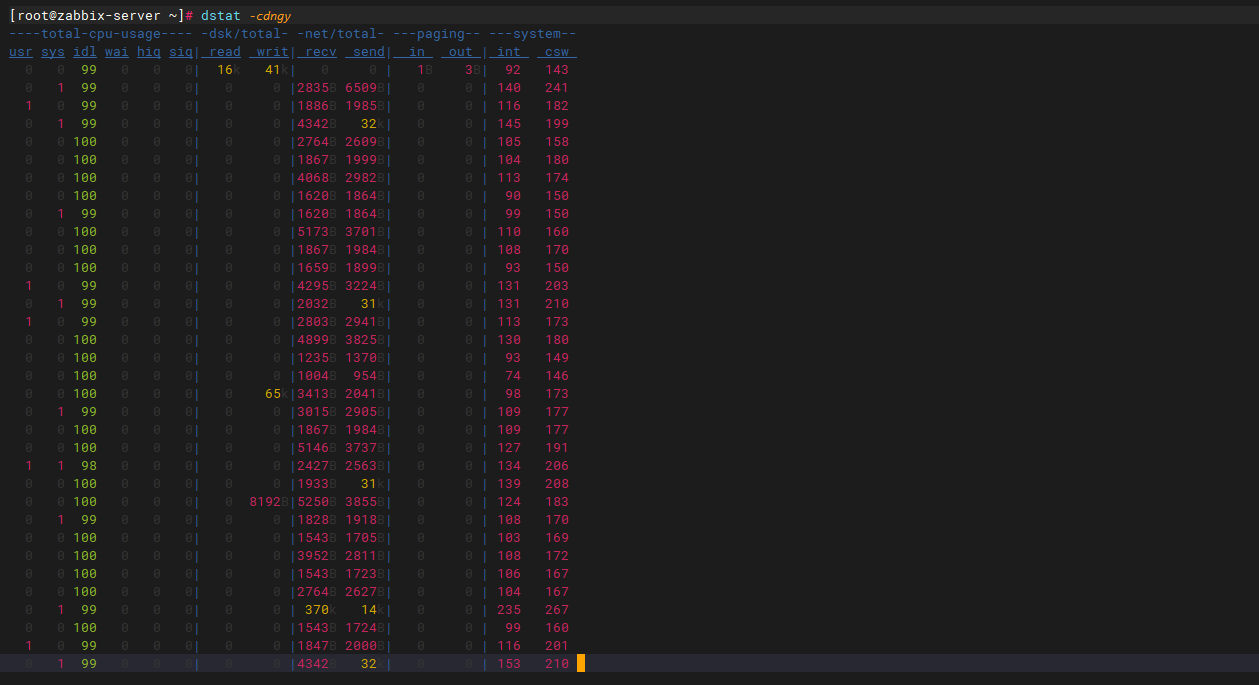
## glances 也可以获取磁盘信息

## lsblk:列出所有可用的块设备信息,并显示他们之间的依赖关系。lsblk命令默认情况下将以树状列出所有块设备
[root@zabbix-server ~]# lsblk
NAME   MAJ:MIN RM  SIZE RO TYPE MOUNTPOINT
sda      8:0    0   20G  0 disk
├─sda1   8:1    0  500M  0 part /boot
├─sda2   8:2    0    1G  0 part [SWAP]
└─sda3   8:3    0 18.5G  0 part /
sr0     11:0    1  4.4G  0 rom

### 磁盘开机自动挂方法
## 创建一块新磁盘
[root@zabbix-server ~]# dd < /dev/zero > /disk1 bs=1024K count=5
## 格式化
[root@zabbix-server ~]# mkfs.ext4 -i 5120 /disk1
## 创建挂载目录并挂载
[root@zabbix-server ~]# mkdir -p /opt/cipan1/
[root@zabbix-server ~]# mount -t ext4 -o loop  /disk1  /opt/cipan1/

## 查看挂载是否成功
[root@zabbix-server ~]# df -h
/dev/loop0      3.9M   53K  3.5M   2% /opt/cipan1

## 用blkid获取我们要开机自启的磁盘的UUID
[root@zabbix-server ~]# blkid /dev/loop0
/dev/loop0: UUID="f9cd4f21-678b-4b4d-8d83-1f4b000610eb" TYPE="ext4"

## 写入开机自动挂载的配置文件
[root@zabbix-server ~]# vim /etc/fstab
UUID=f9cd4f21-678b-4b4d-8d83-1f4b000610eb /opt/cipan1             ext4    defaults        0 0
网络监控命令
## glances:也可以获取网络信息
NETWORK     Rx/s   Tx/s
eth0        592b   15Kb
eth1        17Kb   13Kb
lo            0b     0b
## glances:也可以获取网络信息
NETWORK Rx/s Tx/s
eth0 592b 15Kb
eth1 17Kb 13Kb
lo 0b 0b 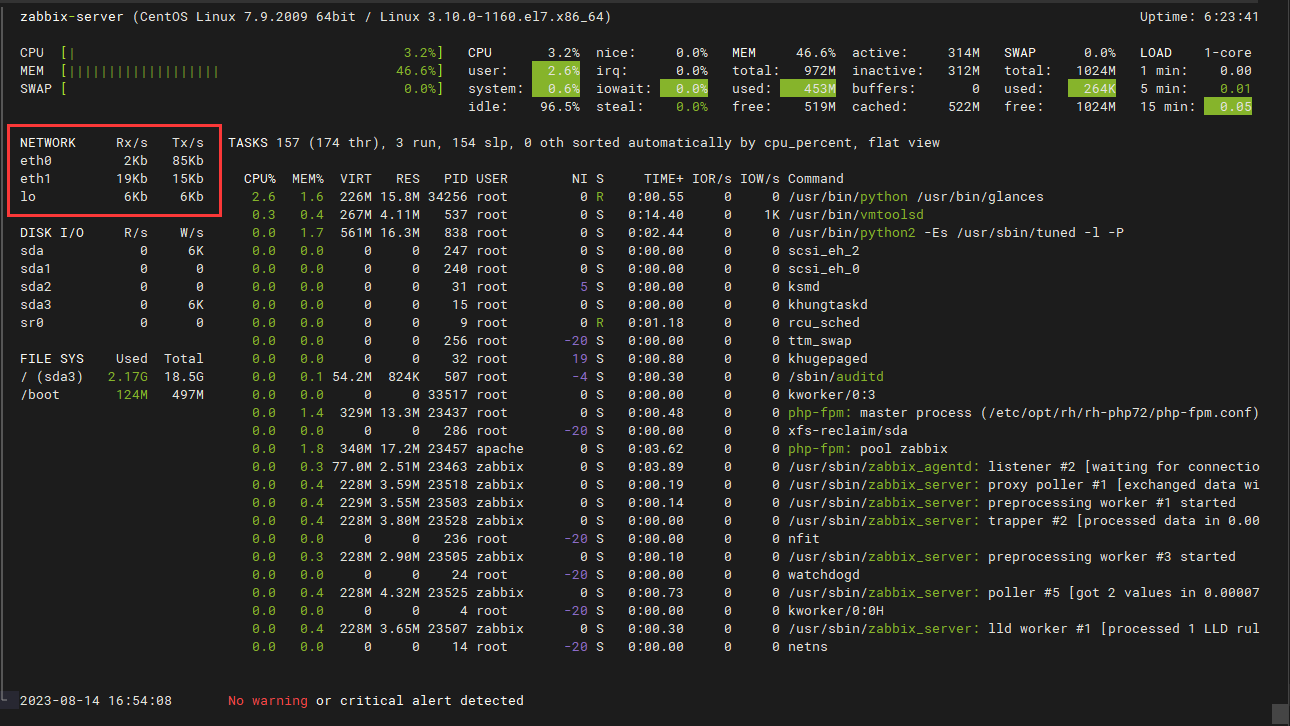
## iftop:可以用来监控网卡的实时流量(可以指定网段)、反向解析IP、显示端口信息等
[root@zabbix-server ~]# iftop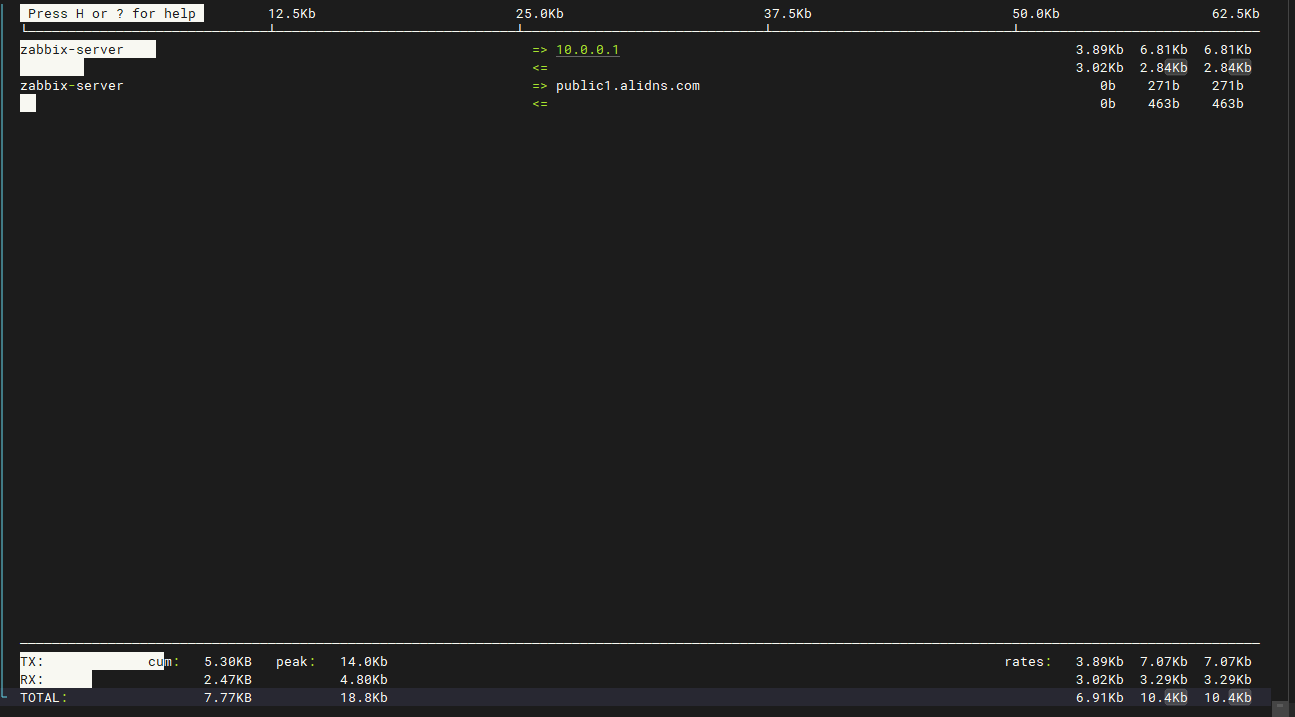
## nethogs:用来按进程或程序实时统计网络带宽使用率,可以直观的显示每个进程占用的带宽
[root@zabbix-server ~]# yum install -y nethogs
[root@zabbix-server ~]# nethogs 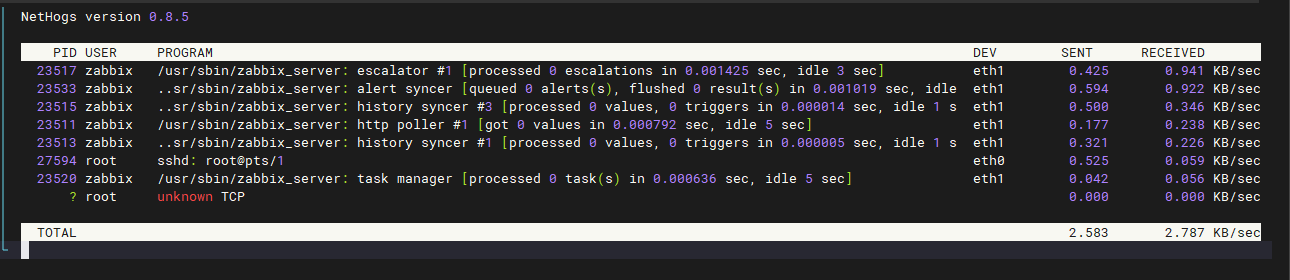
## ifconfig:查看网卡信息 也记录了网络数据
[root@zabbix-server ~]# watch ifconfig

## route:查看路由相关 一个数据传输通过的路程 叫做路由
[root@zabbix-server ~]# route -n
Kernel IP routing table
Destination     Gateway         Genmask         Flags Metric Ref    Use Iface
0.0.0.0         10.0.0.2        0.0.0.0         UG    102    0        0 eth0
10.0.0.0        0.0.0.0         255.255.255.0   U     102    0        0 eth0
172.16.1.0      0.0.0.0         255.255.255.0   U     101    0        0 eth1
TCP11种状态监控命令
## netstat:查看当前服务器上的所有应用TCP状态
[root@zabbix-server ~]# netstat -an

# 查看各状态的进程一共有多少个
[root@zabbix-server ~]# netstat -an|awk '/^tcp/ {print $NF}'|sort|uniq -c
     26 ESTABLISHED
     11 LISTEN
     48 TIME_WAIT

# 查看各状态的进程一共有多少个
[root@zabbix-server ~]# netstat -an|awk '/^tcp/ {++state[$NF]} END {for(key in state) print key," \t" ,state[key]}'
LISTEN           11
ESTABLISHED      26
TIME_WAIT        48
zabbix基础架构
zabbix获取数据的两种方法 1:agent主动上交给server 2:server获取所有agent上的数据并保存(默认)
zabbix-agent的作用:获取本机上的数据,主动上交给server
zabbix-server的作用:获取所有agent上的数据,并保存到数据库中
如果zabbix的数据库出现问题 解决方法如下
- 1. systemctl stop zabbix-server
- 2. drop database zabbix;
- 3. create database zabbix charset utf8 collate utf8_bin;
- 4. zcat /usr/share/doc/zabbix-server-mysql*/create.sql.gz | mysql -uzabbix -p123 -h172.16.1.51 zabbix
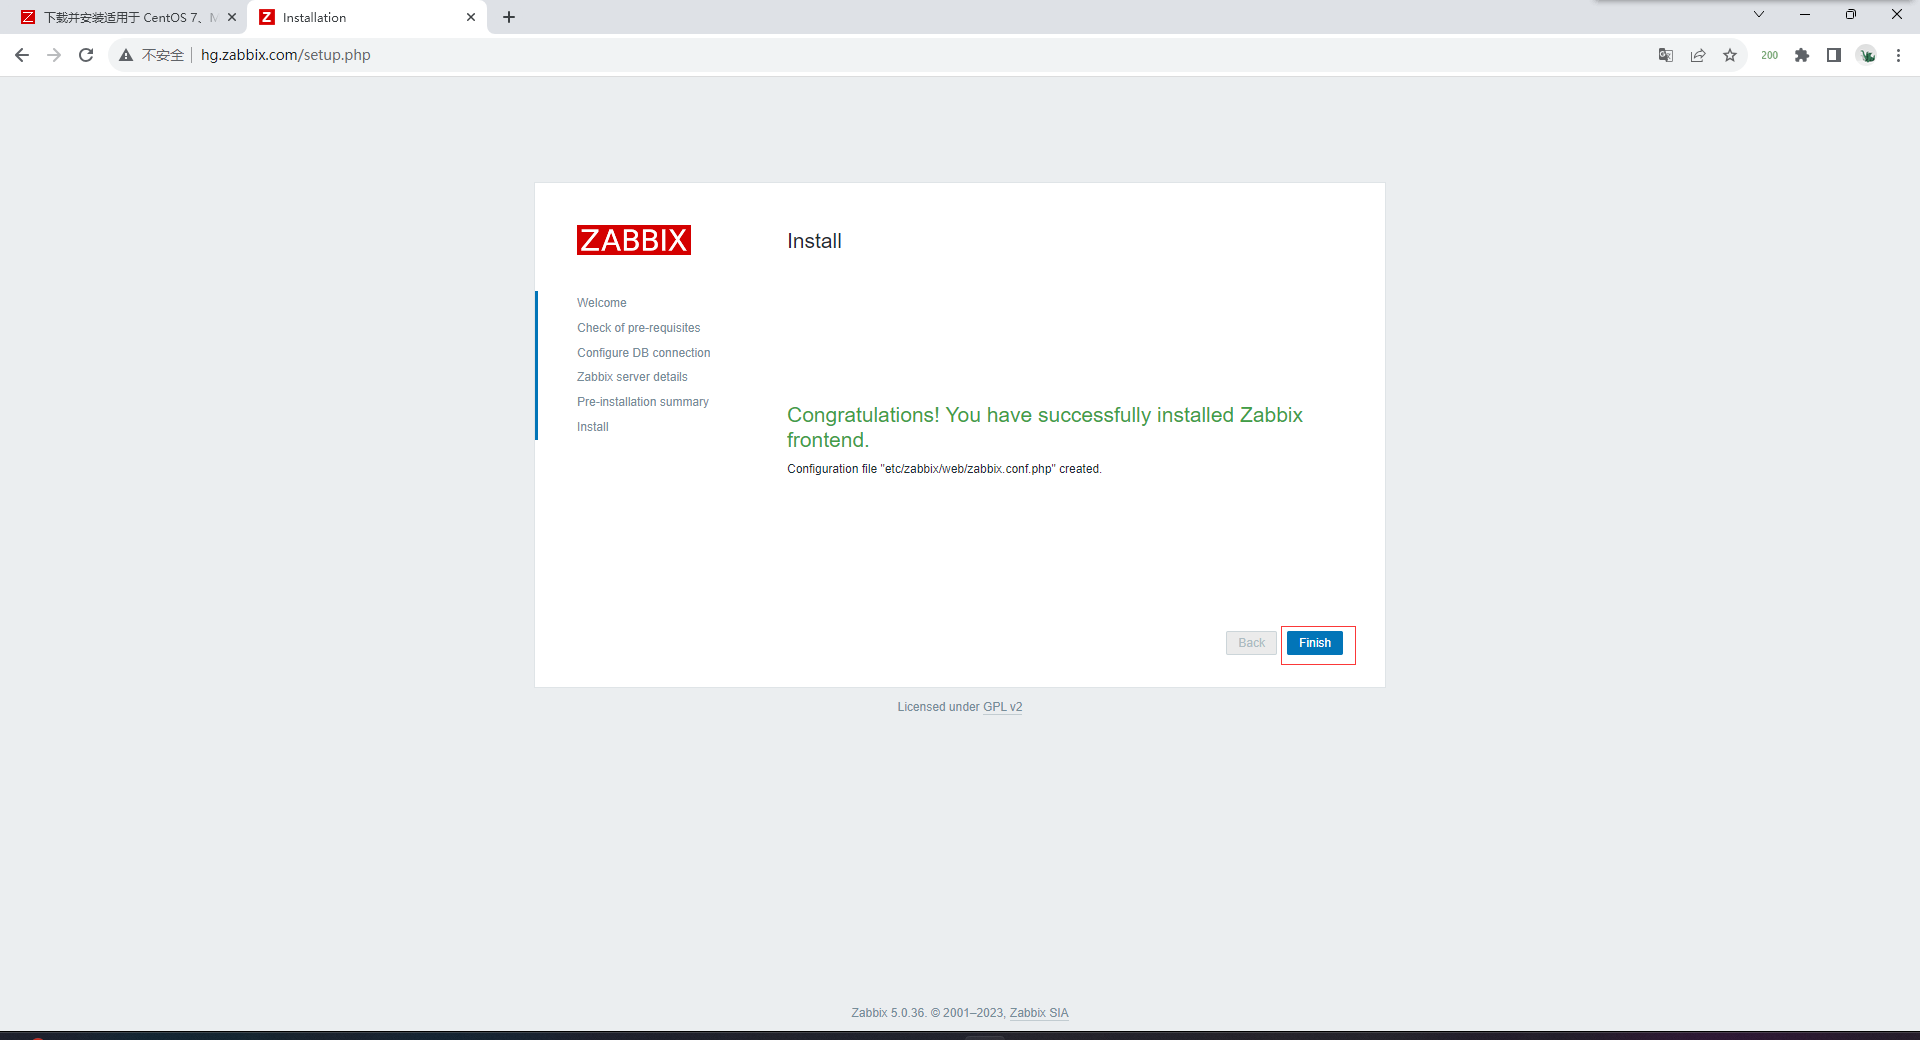
- 5. rm -f /etc/zabbix/web/zabbix.conf.php
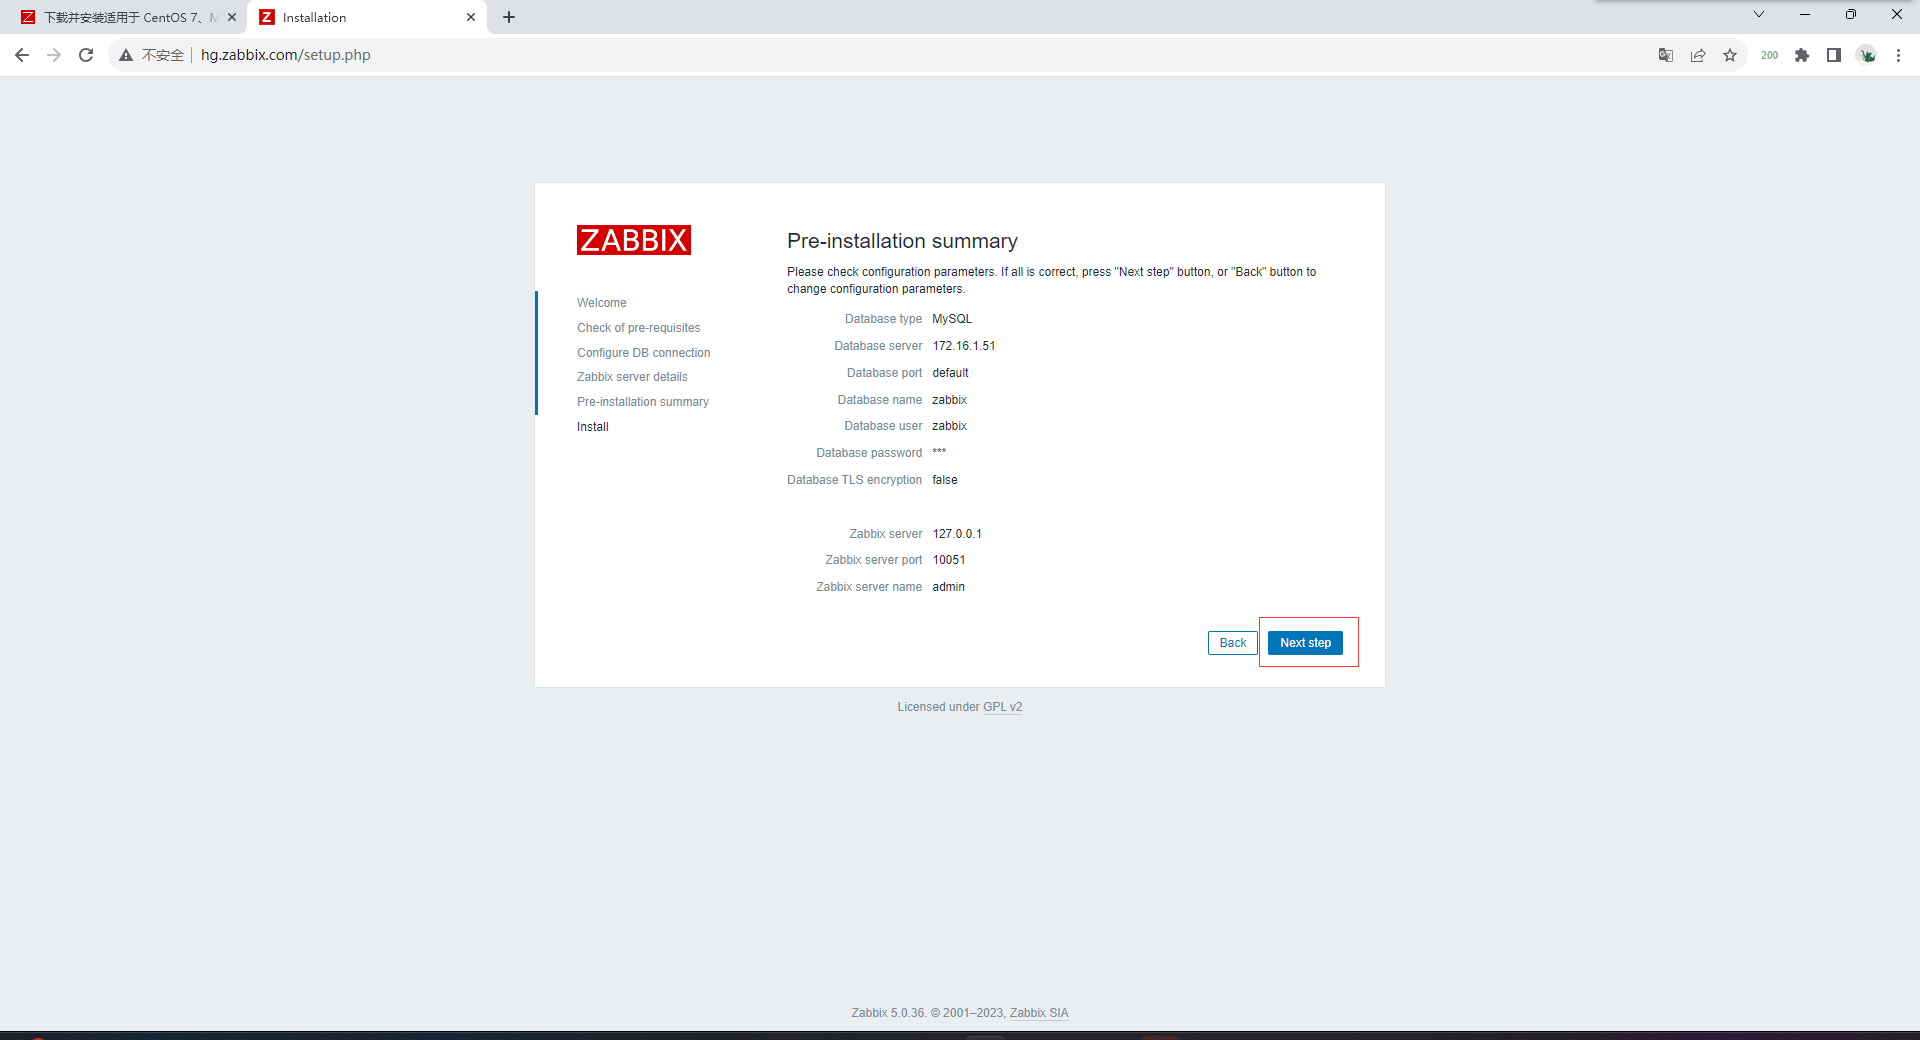
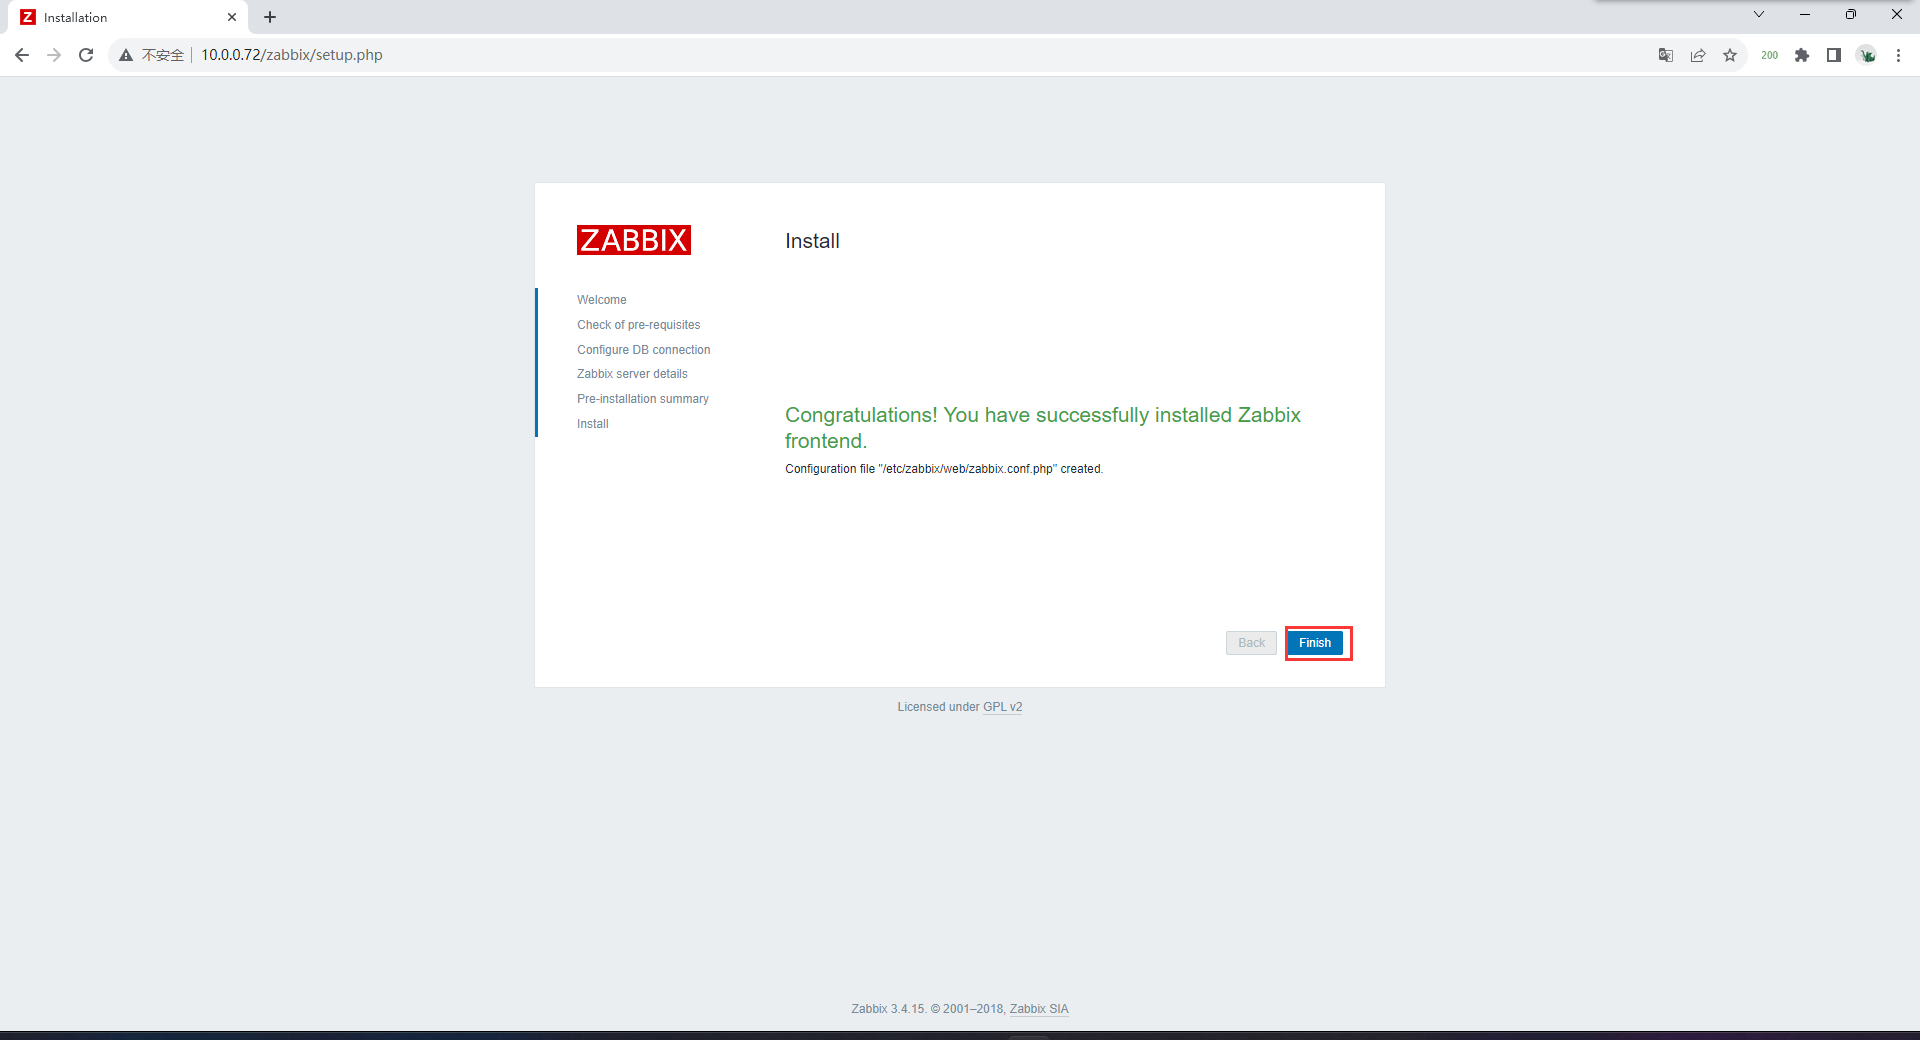
- 6. http://wyk.zabbix.com/setup.php // 重新进入配置页面
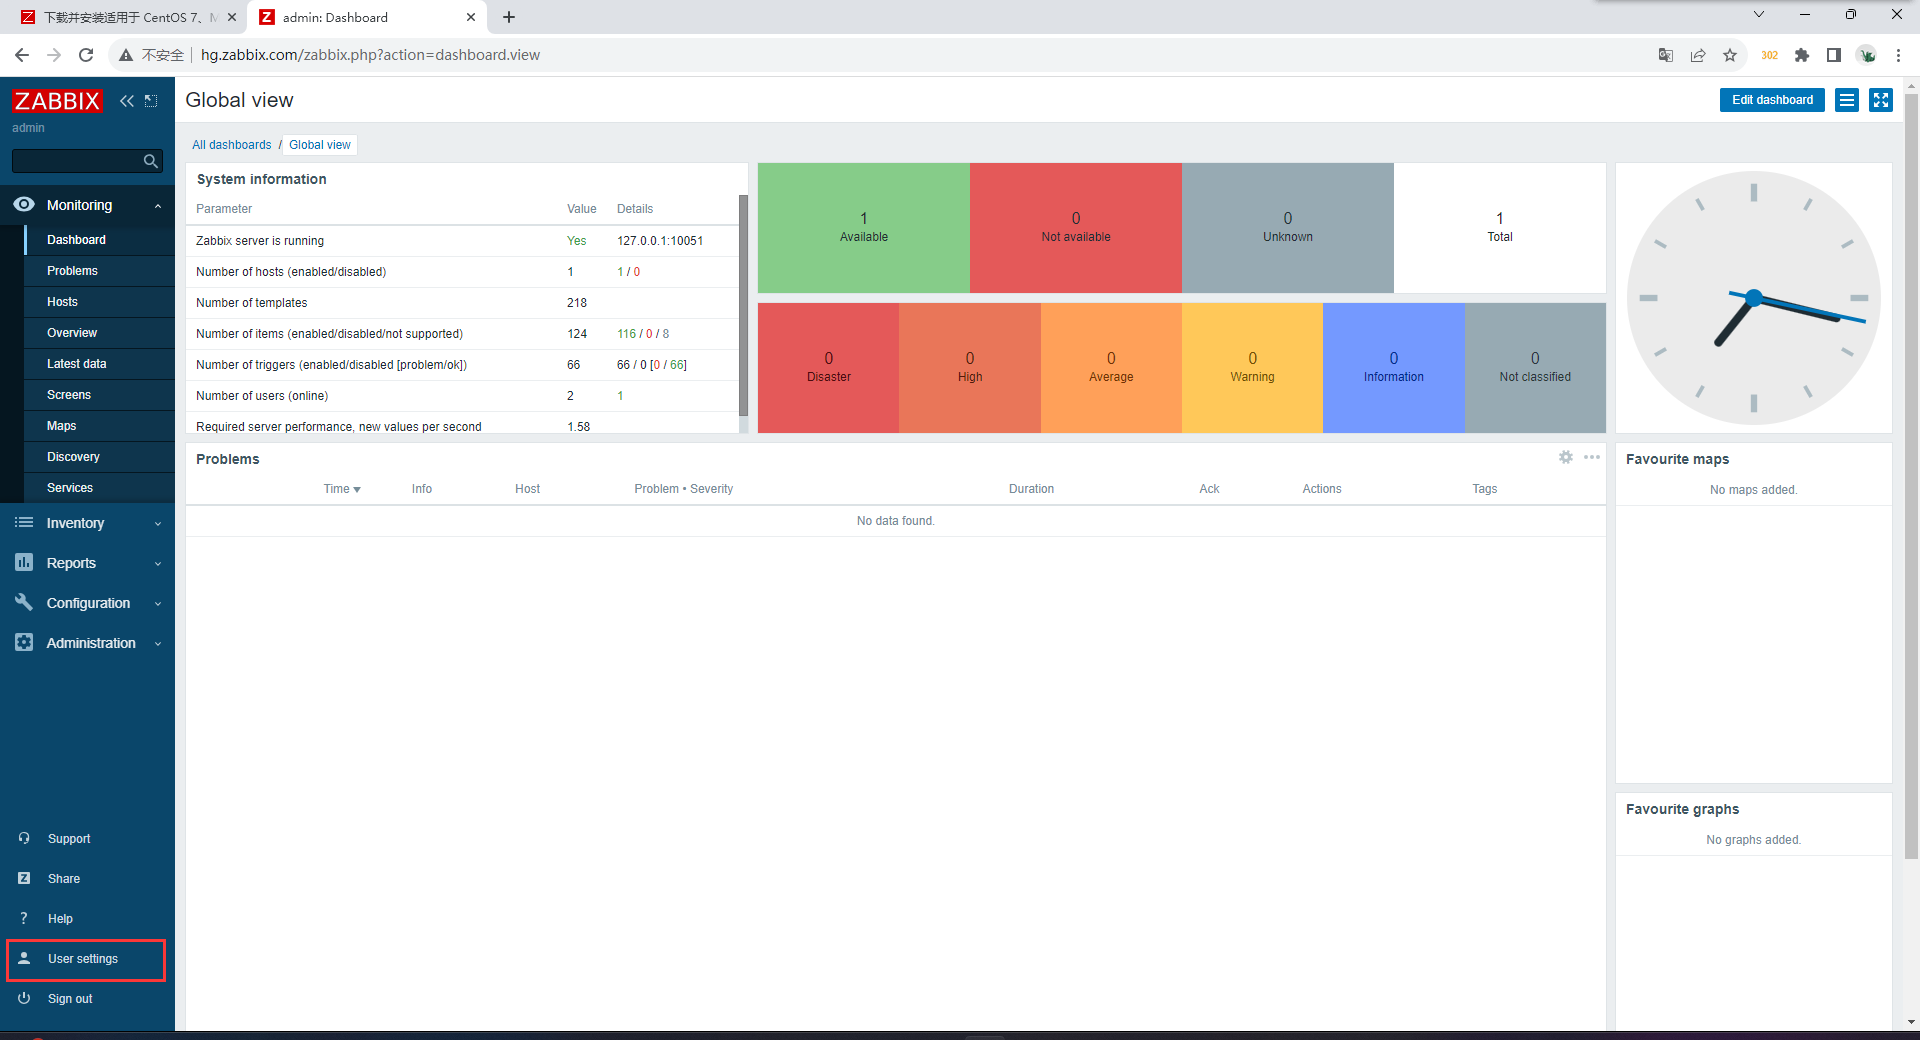
zabbix-web的作用:页面展示,从数据库中获取数据,展示到页面上
zabbix 安装(5.0)
## netstat:查看当前服务器上的所有应用TCP状态
[root@zabbix-server ~]# netstat -an
# 查看各状态的进程一共有多少个
[root@zabbix-server ~]# netstat -an|awk '/^tcp/ {print $NF}'|sort|uniq -c
26 ESTABLISHED
11 LISTEN
48 TIME_WAIT
# 查看各状态的进程一共有多少个
[root@zabbix-server ~]# netstat -an|awk '/^tcp/ {++state[$NF]} END {for(key in state) print key," \t" ,state[key]}'
LISTEN 11
ESTABLISHED 26
TIME_WAIT 48zabbix获取数据的两种方法 1:agent主动上交给server 2:server获取所有agent上的数据并保存(默认)
zabbix-agent的作用:获取本机上的数据,主动上交给server
zabbix-server的作用:获取所有agent上的数据,并保存到数据库中
如果zabbix的数据库出现问题 解决方法如下
- 1. systemctl stop zabbix-server
- 2. drop database zabbix;
- 3. create database zabbix charset utf8 collate utf8_bin;
- 4. zcat /usr/share/doc/zabbix-server-mysql*/create.sql.gz | mysql -uzabbix -p123 -h172.16.1.51 zabbix
- 5. rm -f /etc/zabbix/web/zabbix.conf.php
- 6. http://wyk.zabbix.com/setup.php // 重新进入配置页面
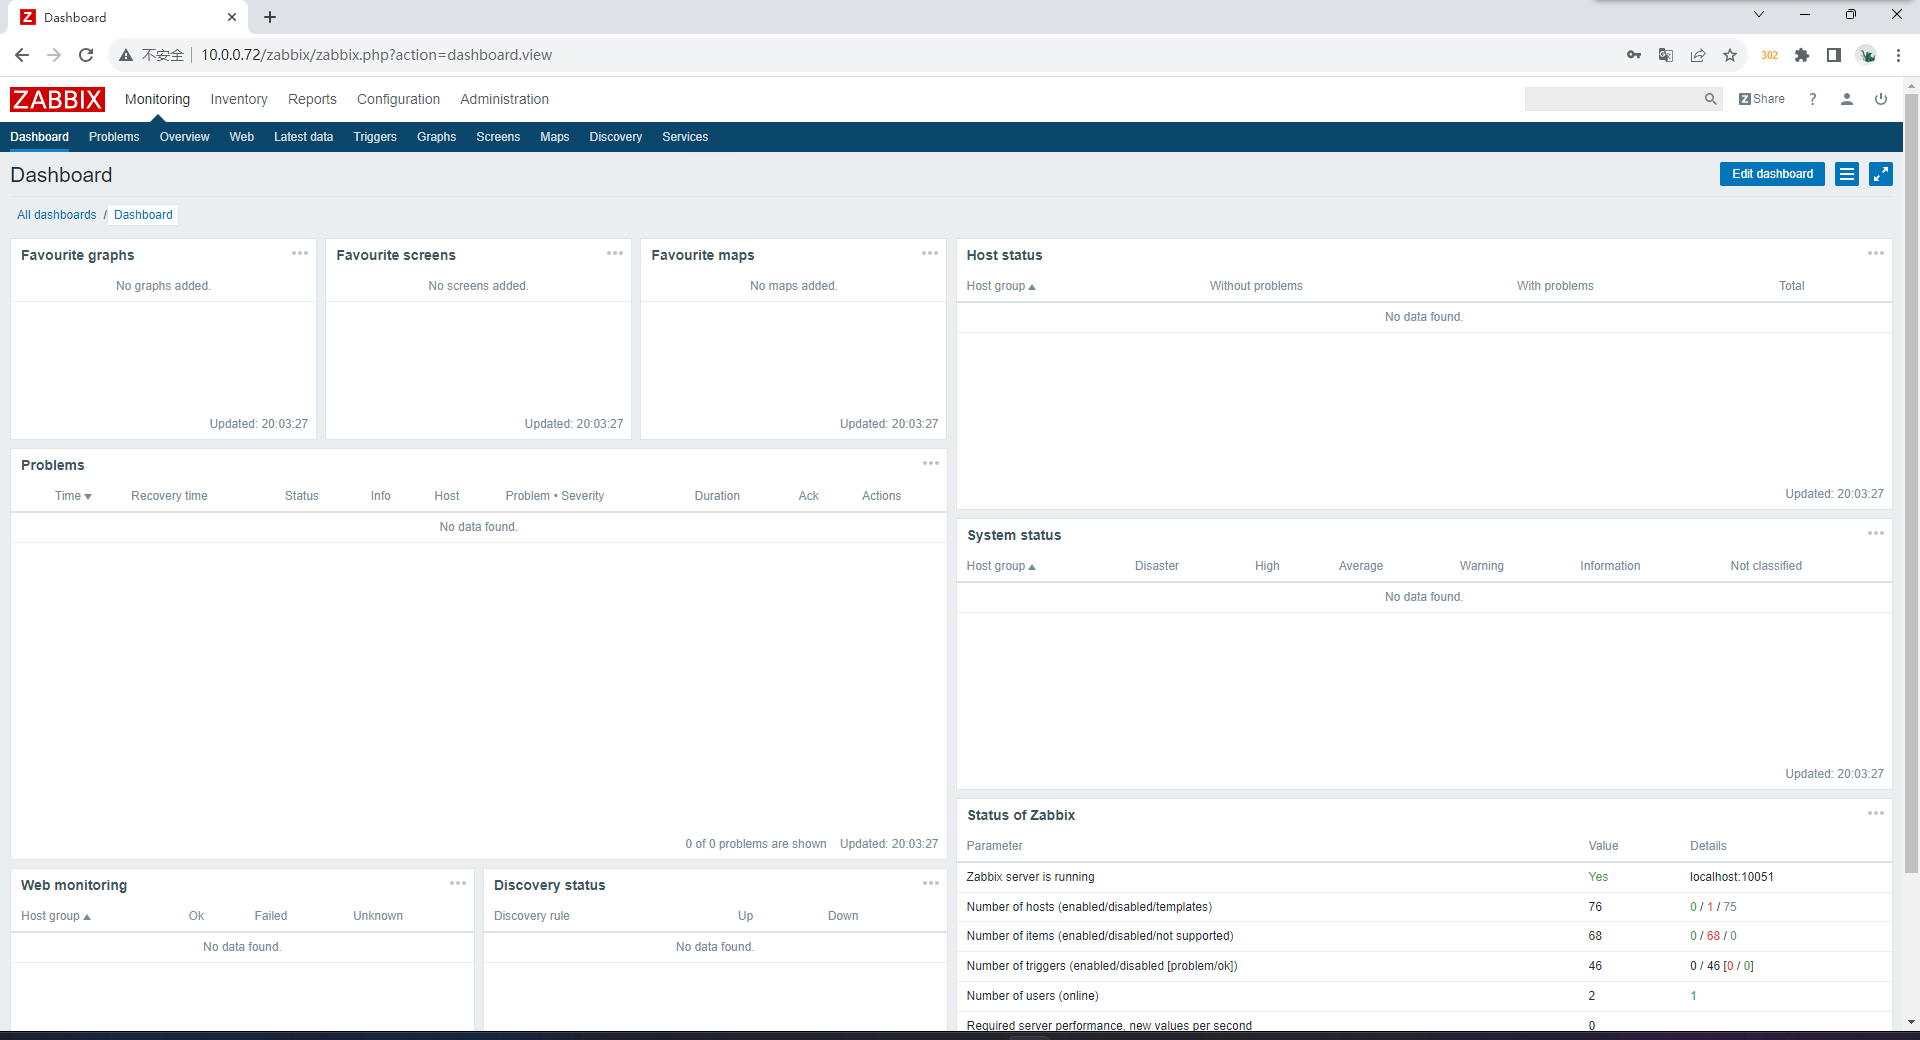
zabbix-web的作用:页面展示,从数据库中获取数据,展示到页面上
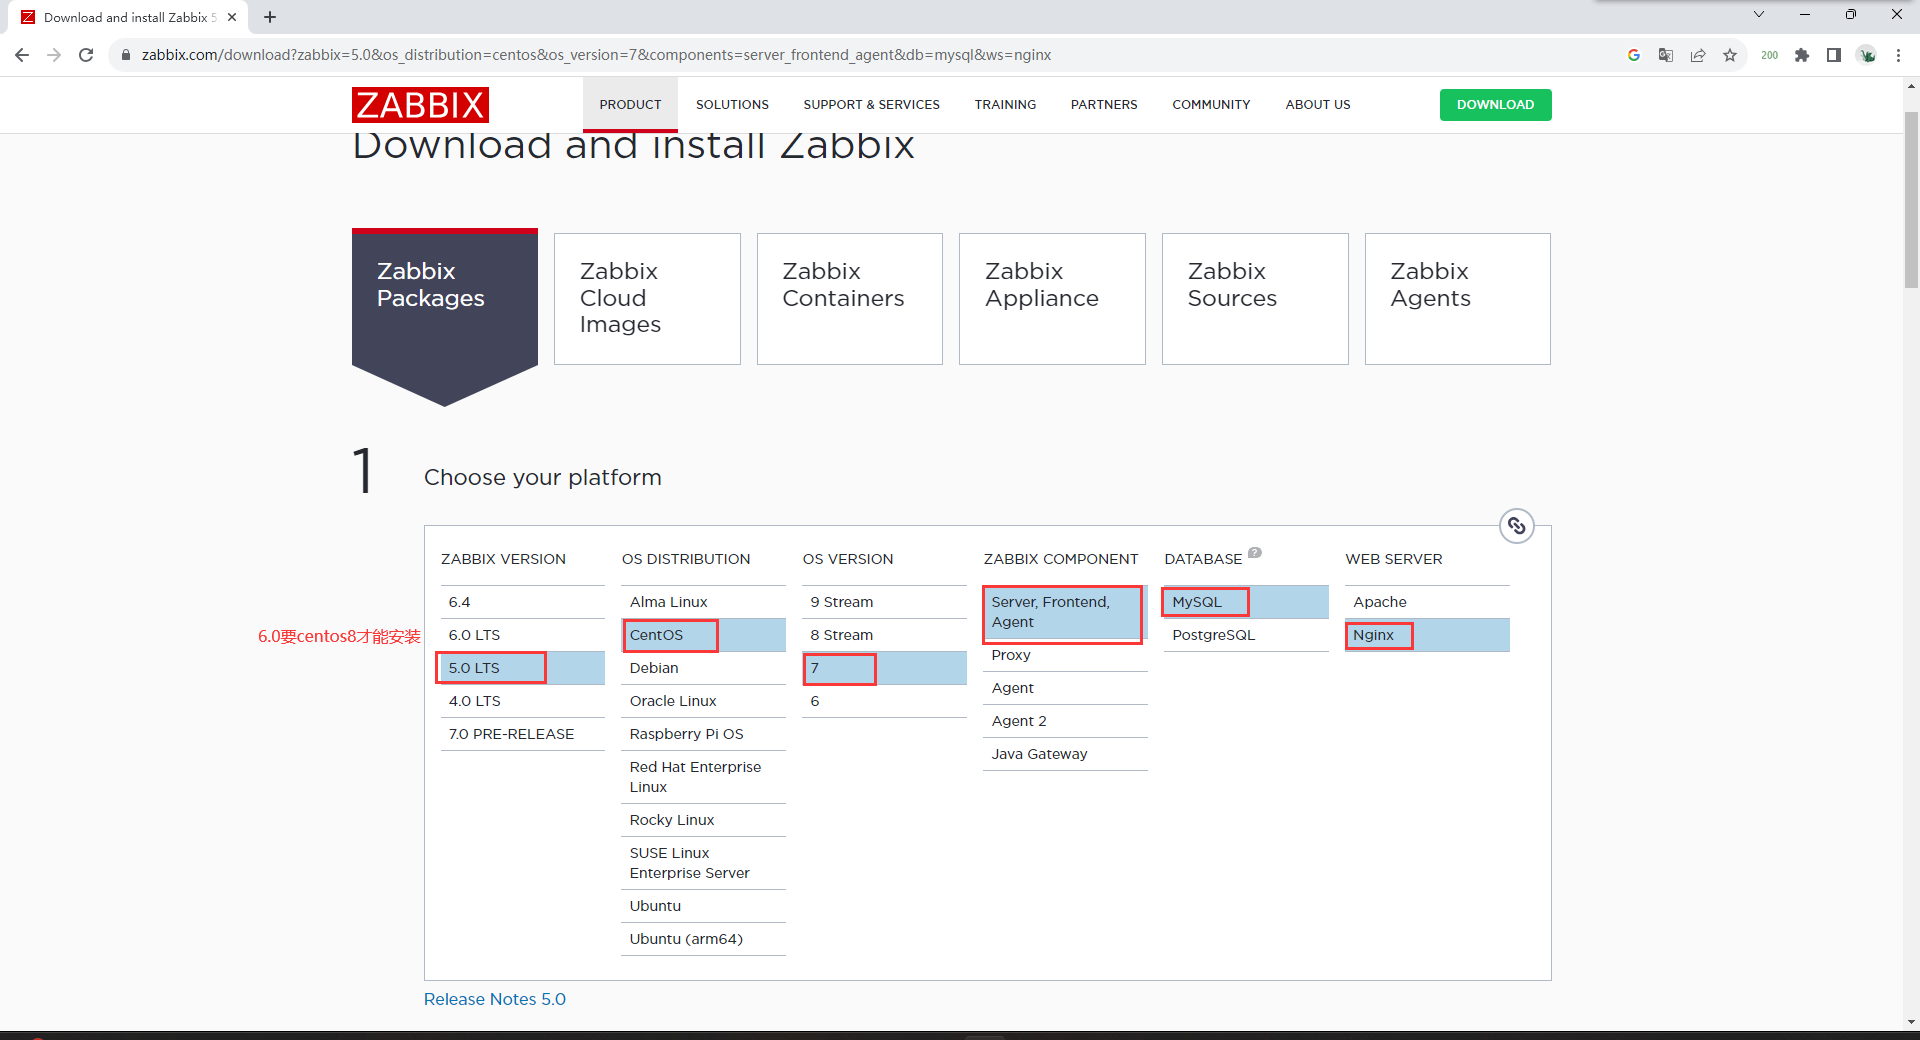
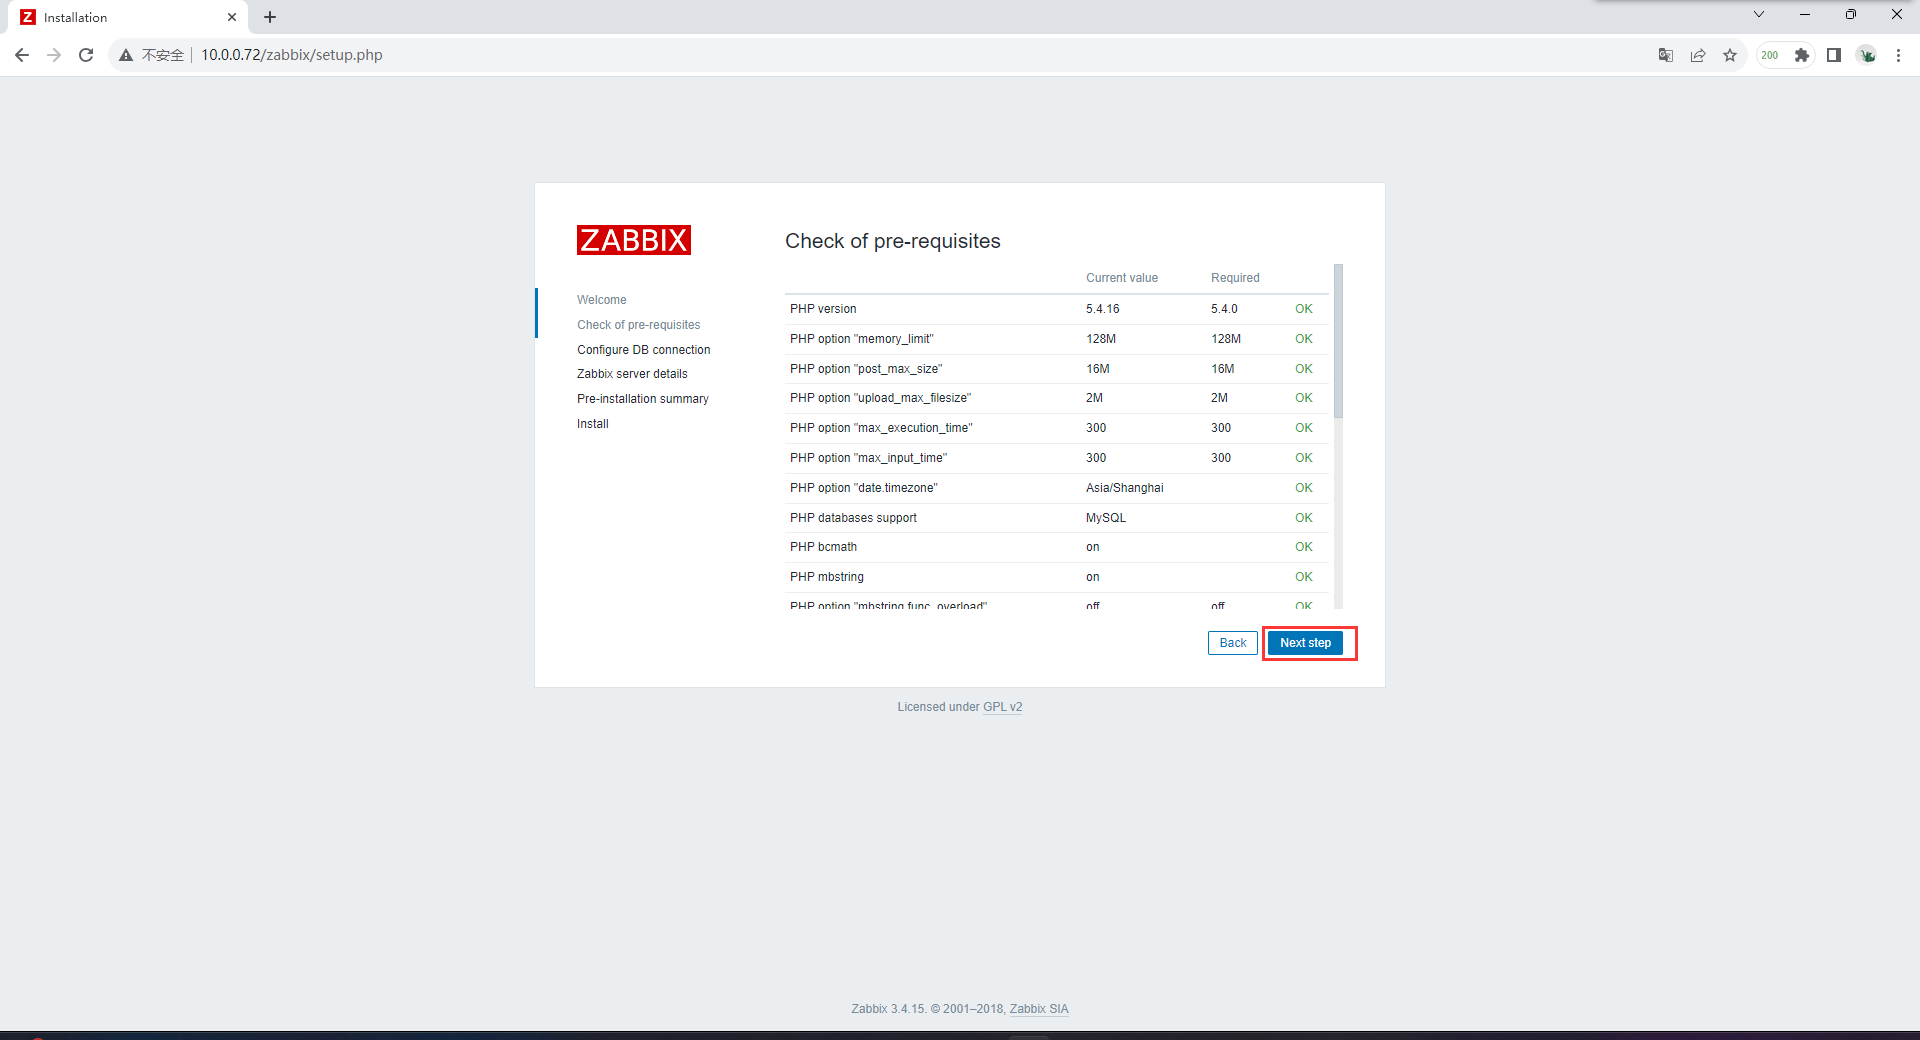
选择完成后往下拉就是官方文档当cv工程师即可
# 下载zabbix的yum源
[root@zabbix-server ~]# rpm -Uvh https://repo.zabbix.com/zabbix/5.0/rhel/7/x86_64/zabbix-release-5.0-1.el7.noarch.rpm
# 安装zabbix的服务端和客户端
[root@zabbix-server ~]# yum install -y zabbix-server-mysql zabbix-agent
# 下载zabbix前端web页面的yum源
[root@zabbix-server ~]# yum install centos-release-scl -y
# 打开zabbix的yum源中的前端仓库
[root@zabbix-server ~]# vim /etc/yum.repos.d/zabbix.repo
[zabbix-frontend]
name=Zabbix Official Repository frontend - $basearch
baseurl=http://repo.zabbix.com/zabbix/5.0/rhel/7/$basearch/frontend
enabled=1 //0改为1
gpgcheck=1
gpgkey=file:///etc/pki/rpm-gpg/RPM-GPG-KEY-ZABBIX-A14FE591
# 安装zabbix前端web页面
[root@zabbix-server ~]# yum install zabbix-web-mysql-scl zabbix-nginx-conf-scl -y
# 建库建用户
mysql> create database zabbix character set utf8 collate utf8_bin;
mysql> grant all on zabbix.* to zabbix@'172.16.1.%' identified by '123';
# 安装mariadb客户端
[root@zabbix-server ~]# yum install -y mariadb
# 导入sql文件
[root@zabbix ~]# zcat /usr/share/doc/zabbix-server-mysql*/create.sql.gz | mysql -uzabbix -p123 -h172.16.1.51 zabbix
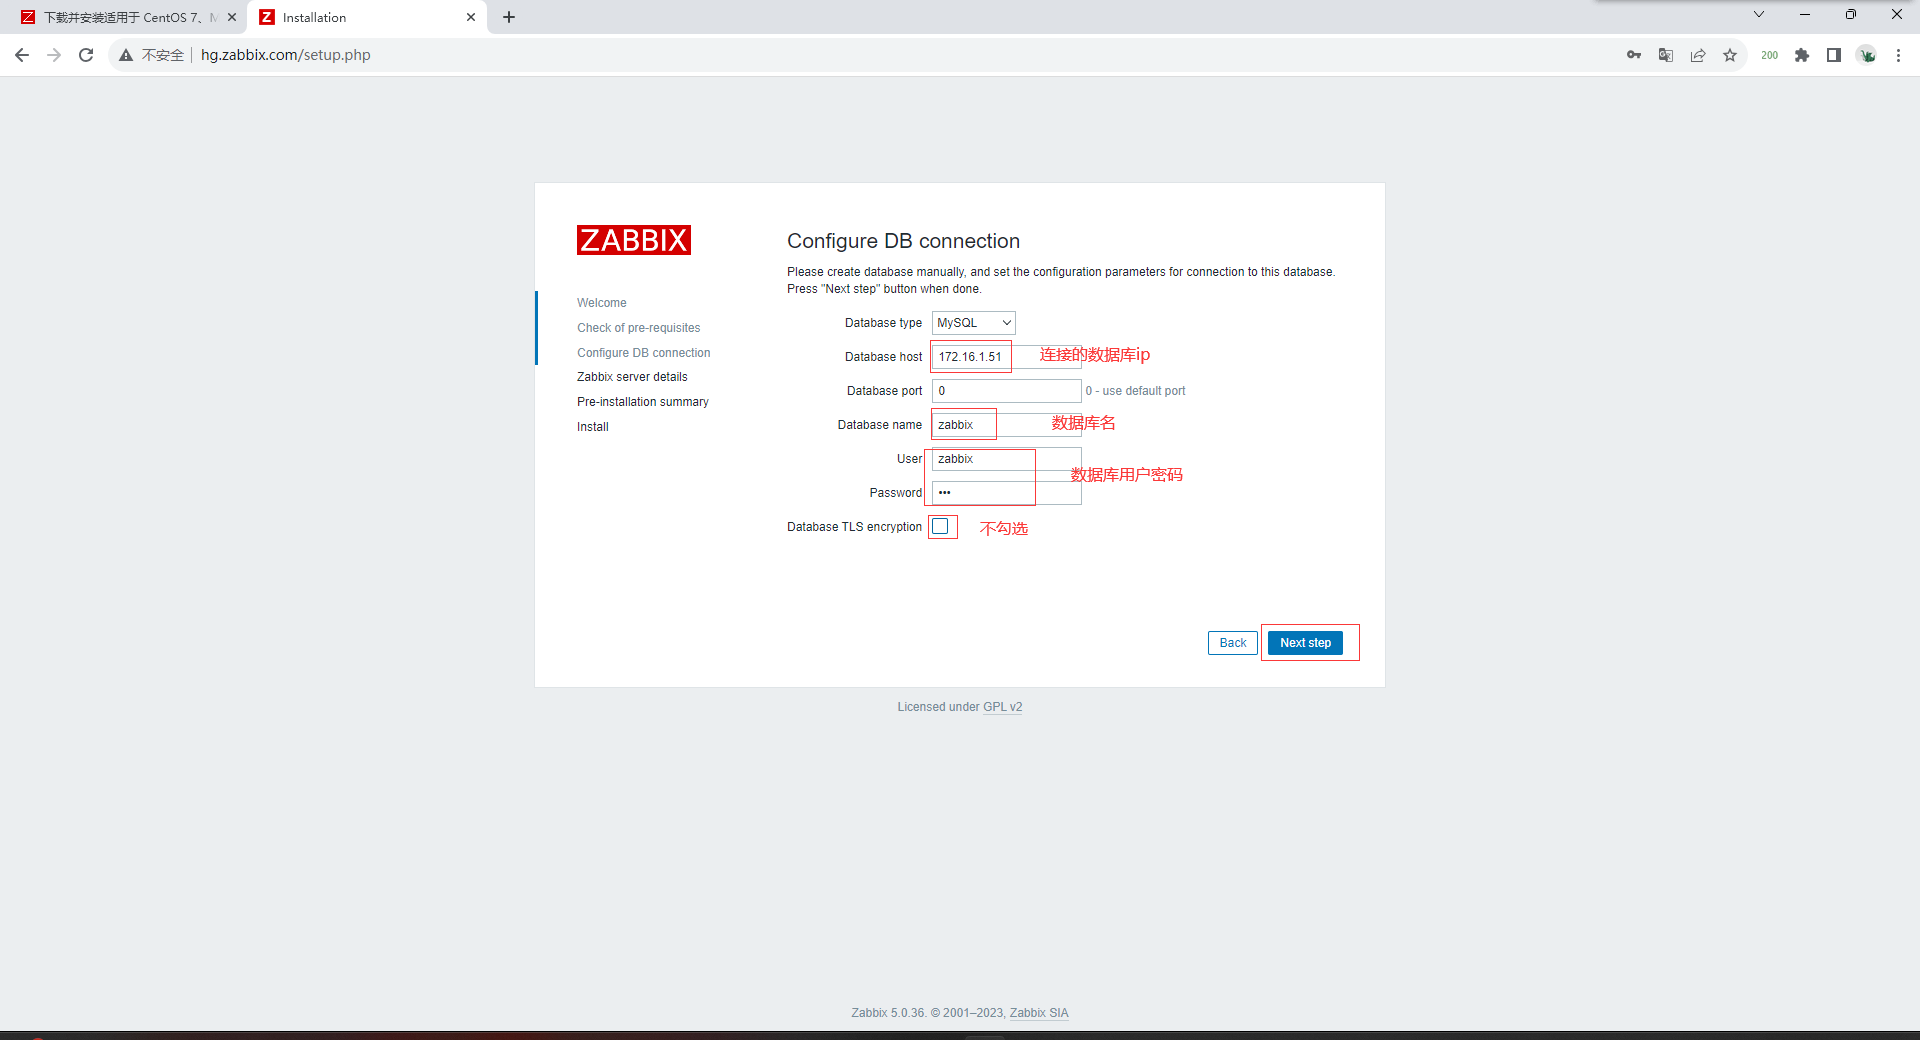
# 修改zabbix服务端配置文件
[root@zabbix-server ~]# vim /etc/zabbix/zabbix_server.conf
DBHost=172.16.1.51
DBUser=zabbix
DBName=zabbix
DBPassword=123
# 修改zabbix的nginx配置文件
[root@zabbix-server ~]# vim /etc/opt/rh/rh-nginx116/nginx/conf.d/zabbix.conf
server {
listen 80; # 打开这两行的注释 可以自定义域名端口
server_name hg.zabbix.com;
...
}
# 修改zabbix的php配置文件
[root@zabbix01 ~]# vim /etc/opt/rh/rh-php72/php-fpm.d/zabbix.conf
[zabbix]
listen.acl_users = apache,nginx
php_value[date.timezone] = Asia/Shanghai ## 改完解除注释
# 启动并加入开机自启
[root@zabbix-server ~]# systemctl start zabbix-server zabbix-agent rh-nginx116-nginx rh-php72-php-fpm
[root@zabbix-server ~]# systemctl enable zabbix-server zabbix-agent rh-nginx116-nginx rh-php72-php-fpm
[root@zabbix01 ~]# netstat -lntup|grep 10050
tcp 0 0 0.0.0.0:10050 0.0.0.0:* LISTEN 102137/zabbix_agent
tcp6 0 0 :::10050 :::* LISTEN 102137/zabbix_agent
[root@zabbix ~]# netstat -lntup|grep 10051
tcp 0 0 0.0.0.0:10051 0.0.0.0:* LISTEN 102333/zabbix_serve
tcp6 0 0 :::10051 :::* LISTEN 102333/zabbix_serve
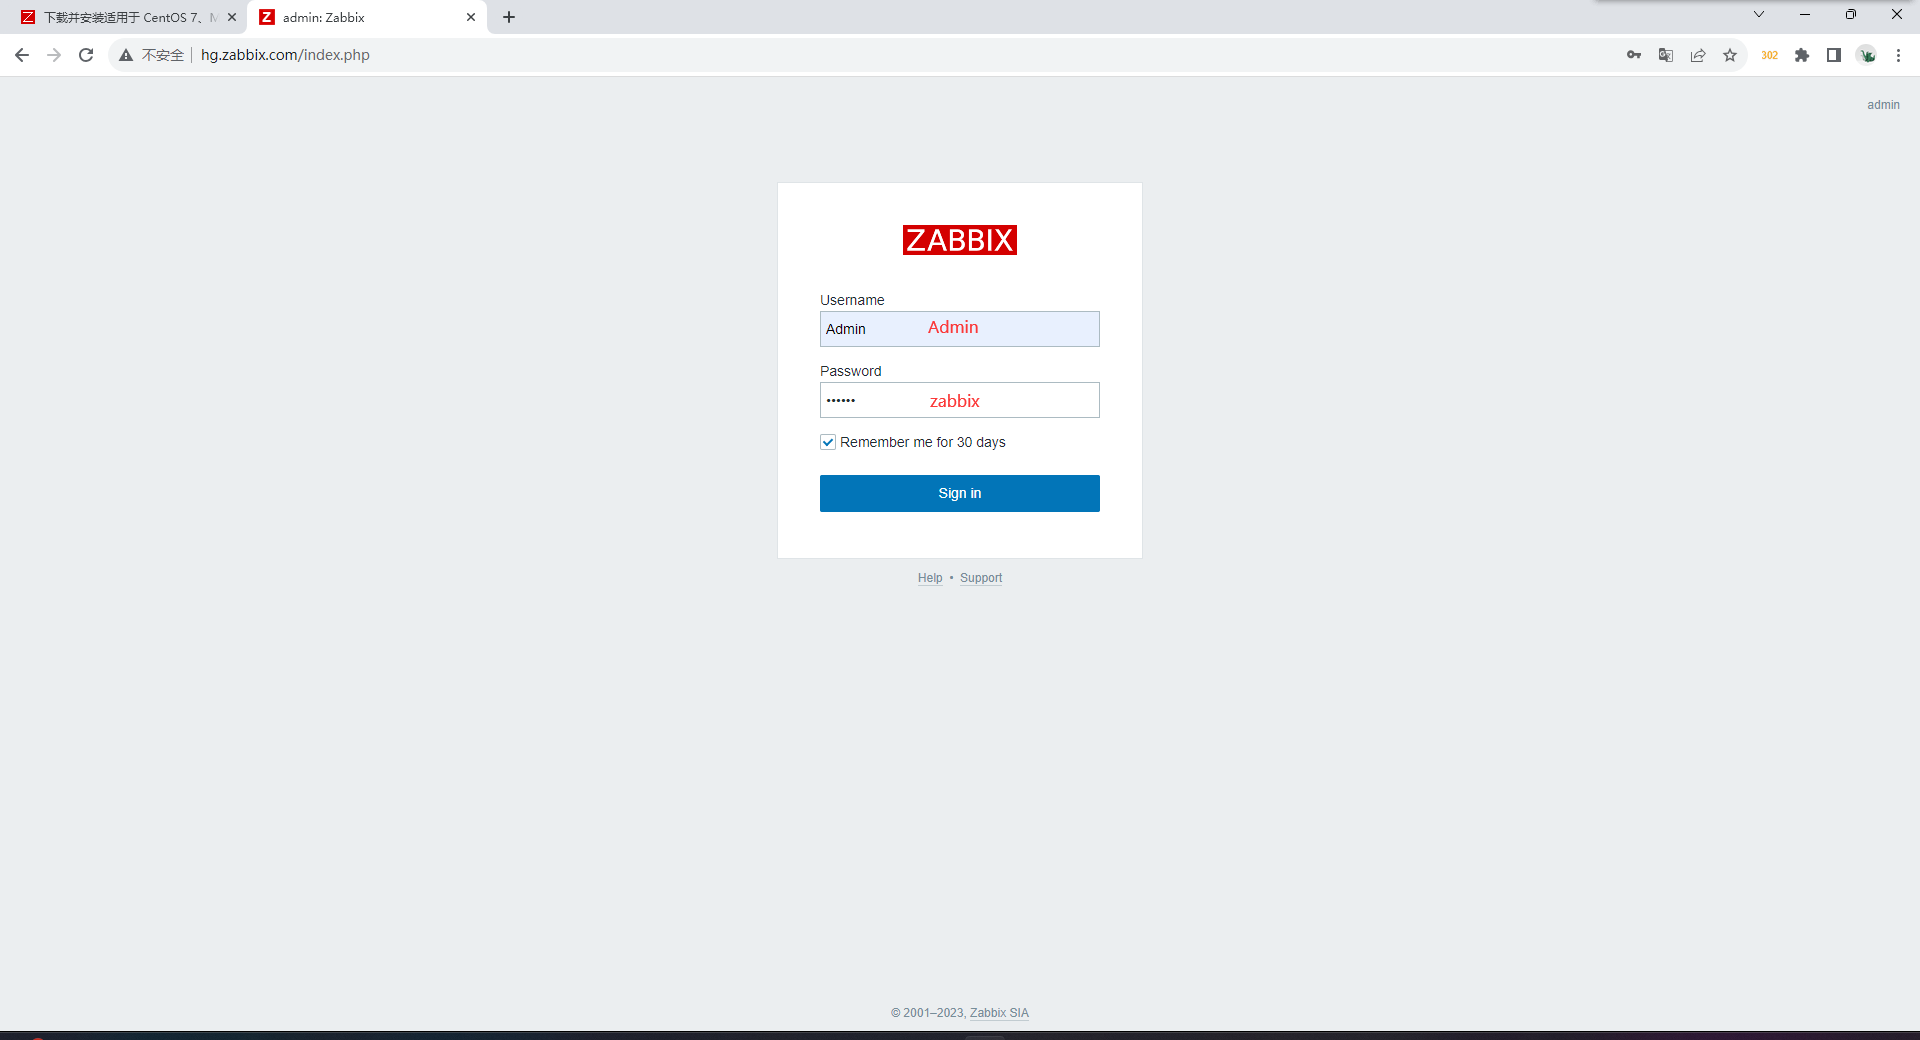
# 访问hg.zabbix.com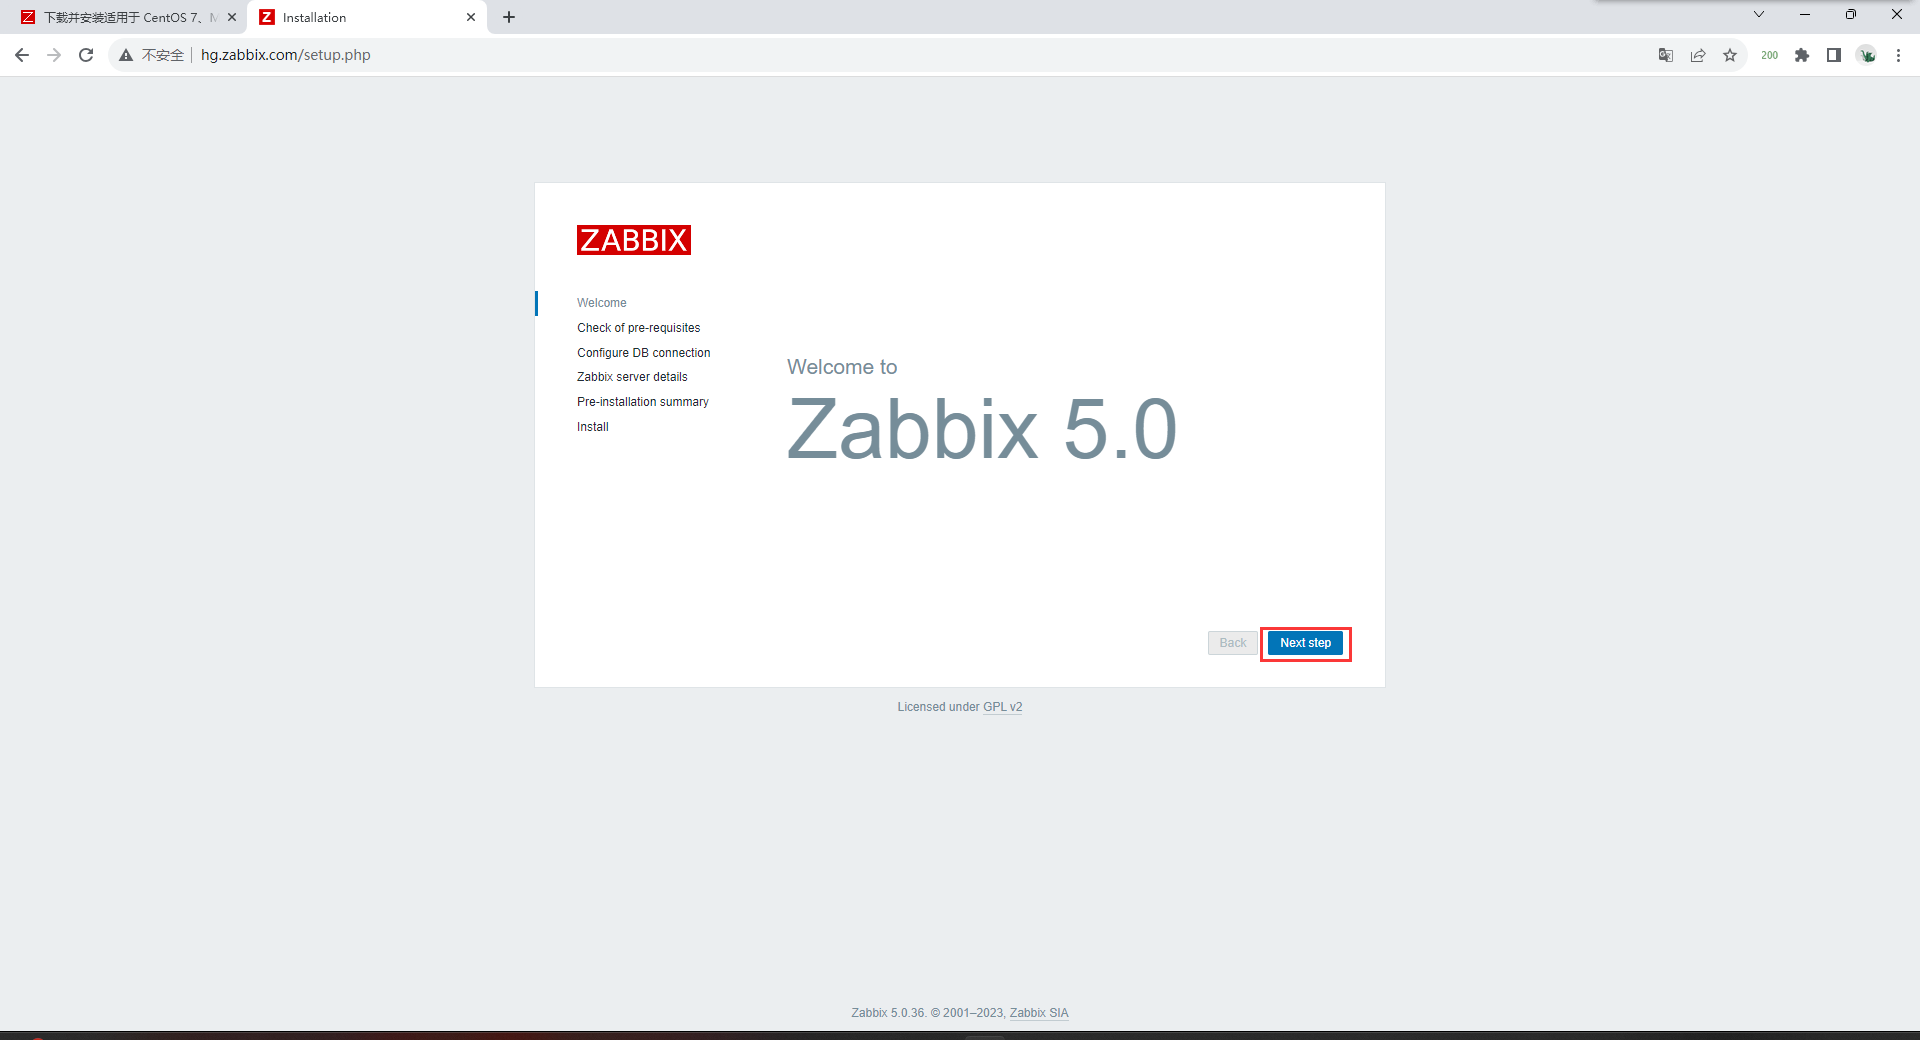

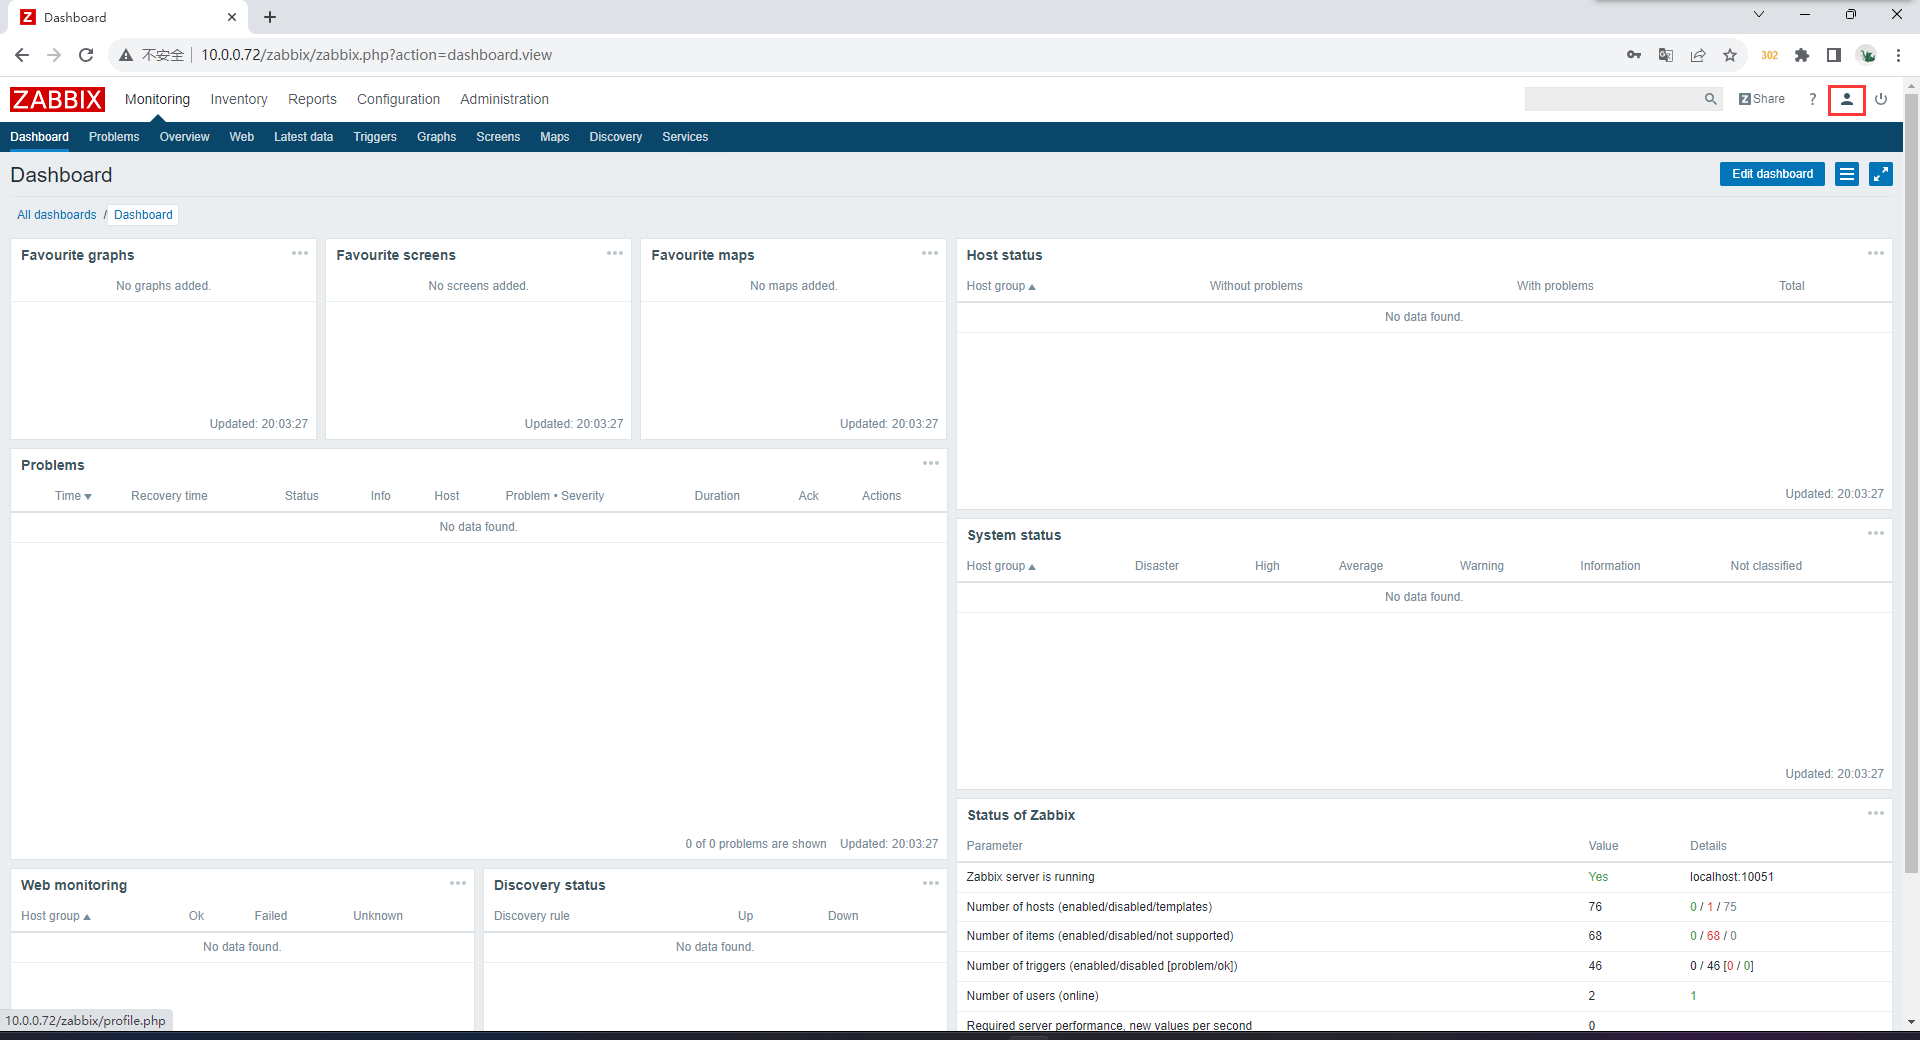
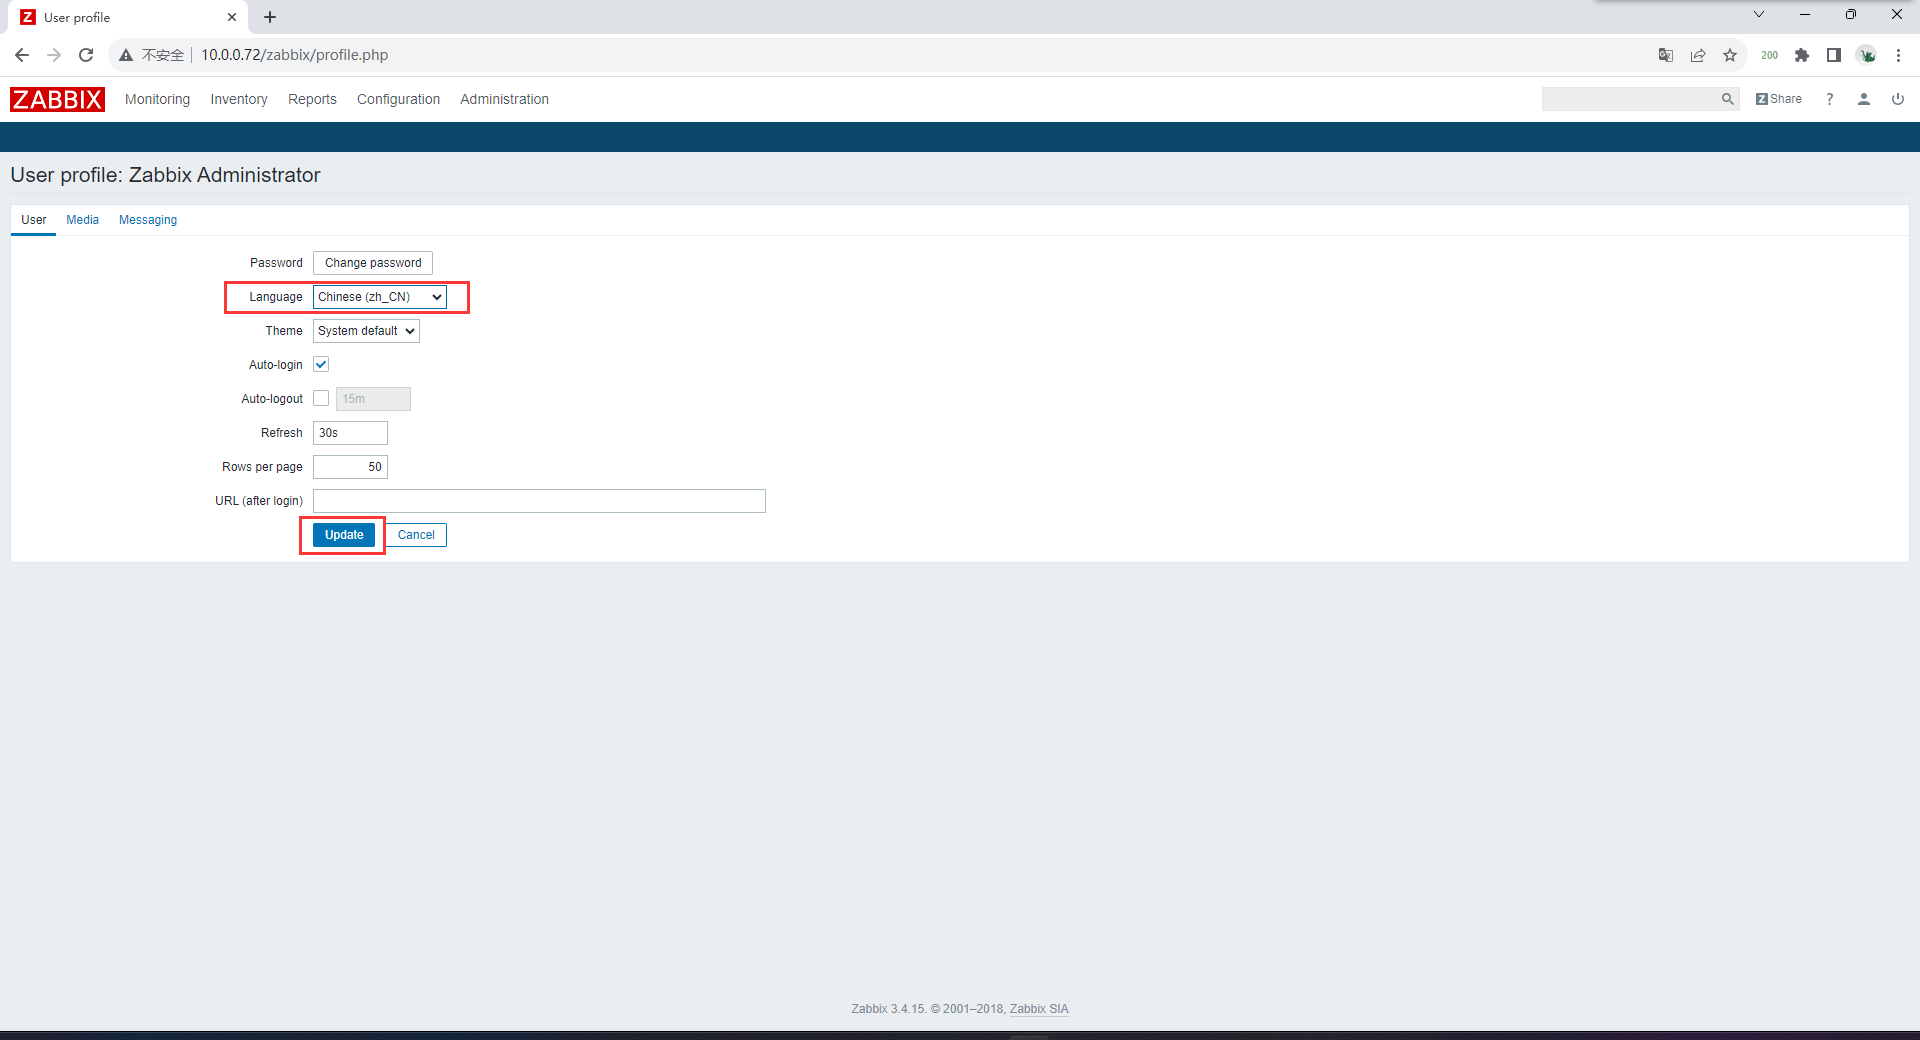
汉化
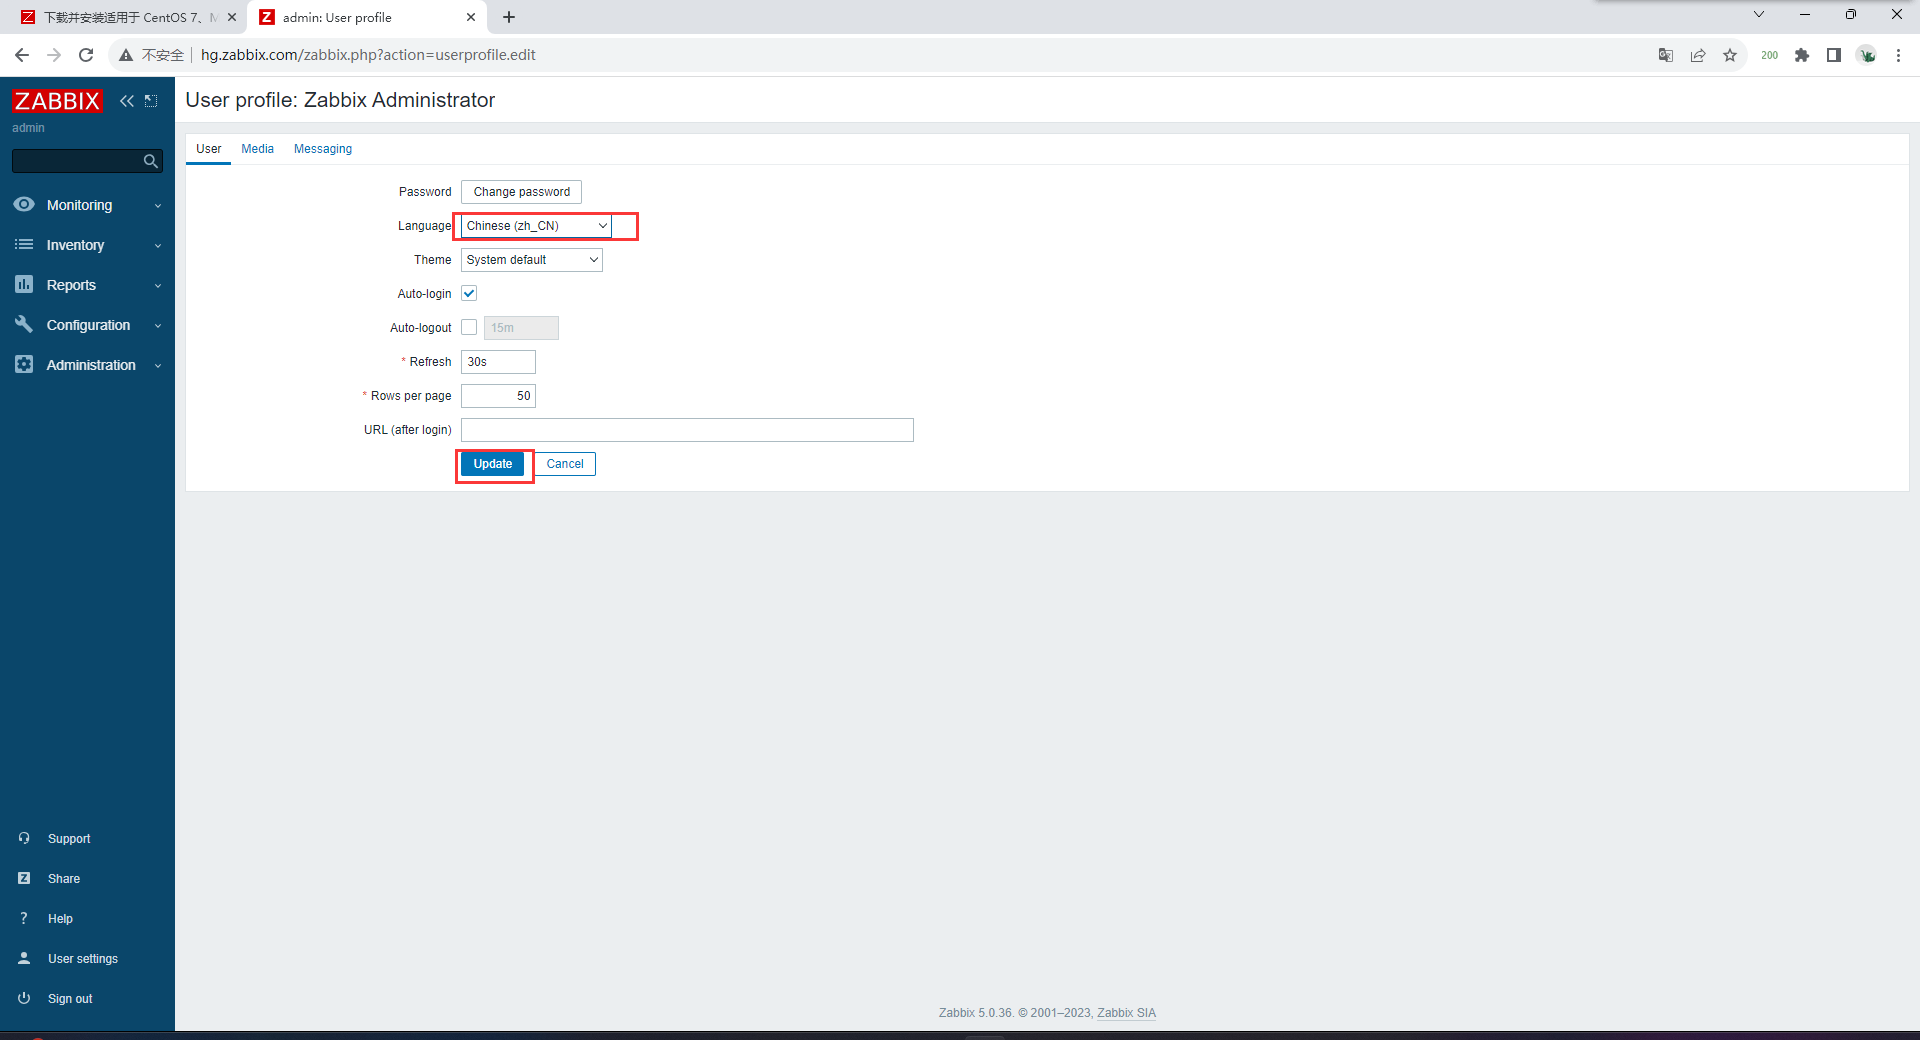
汉化以后出现图形汉字无法显示
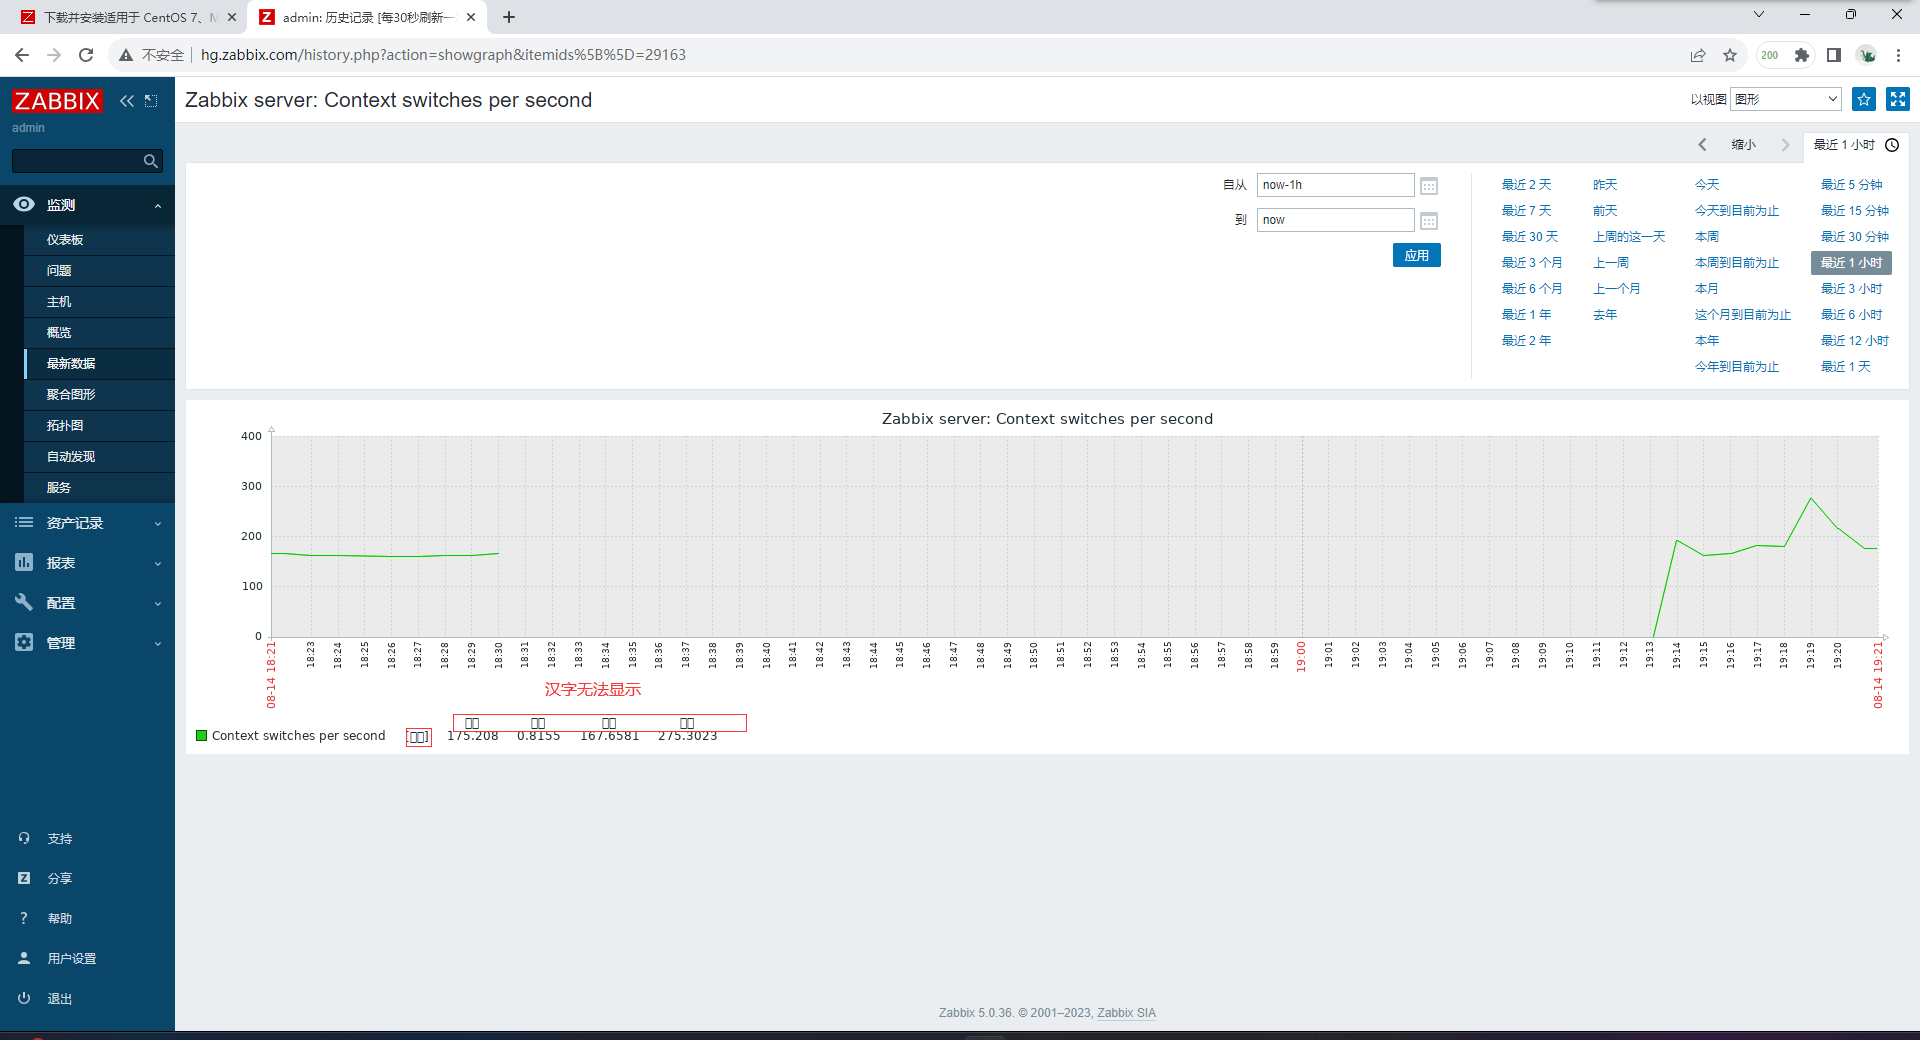
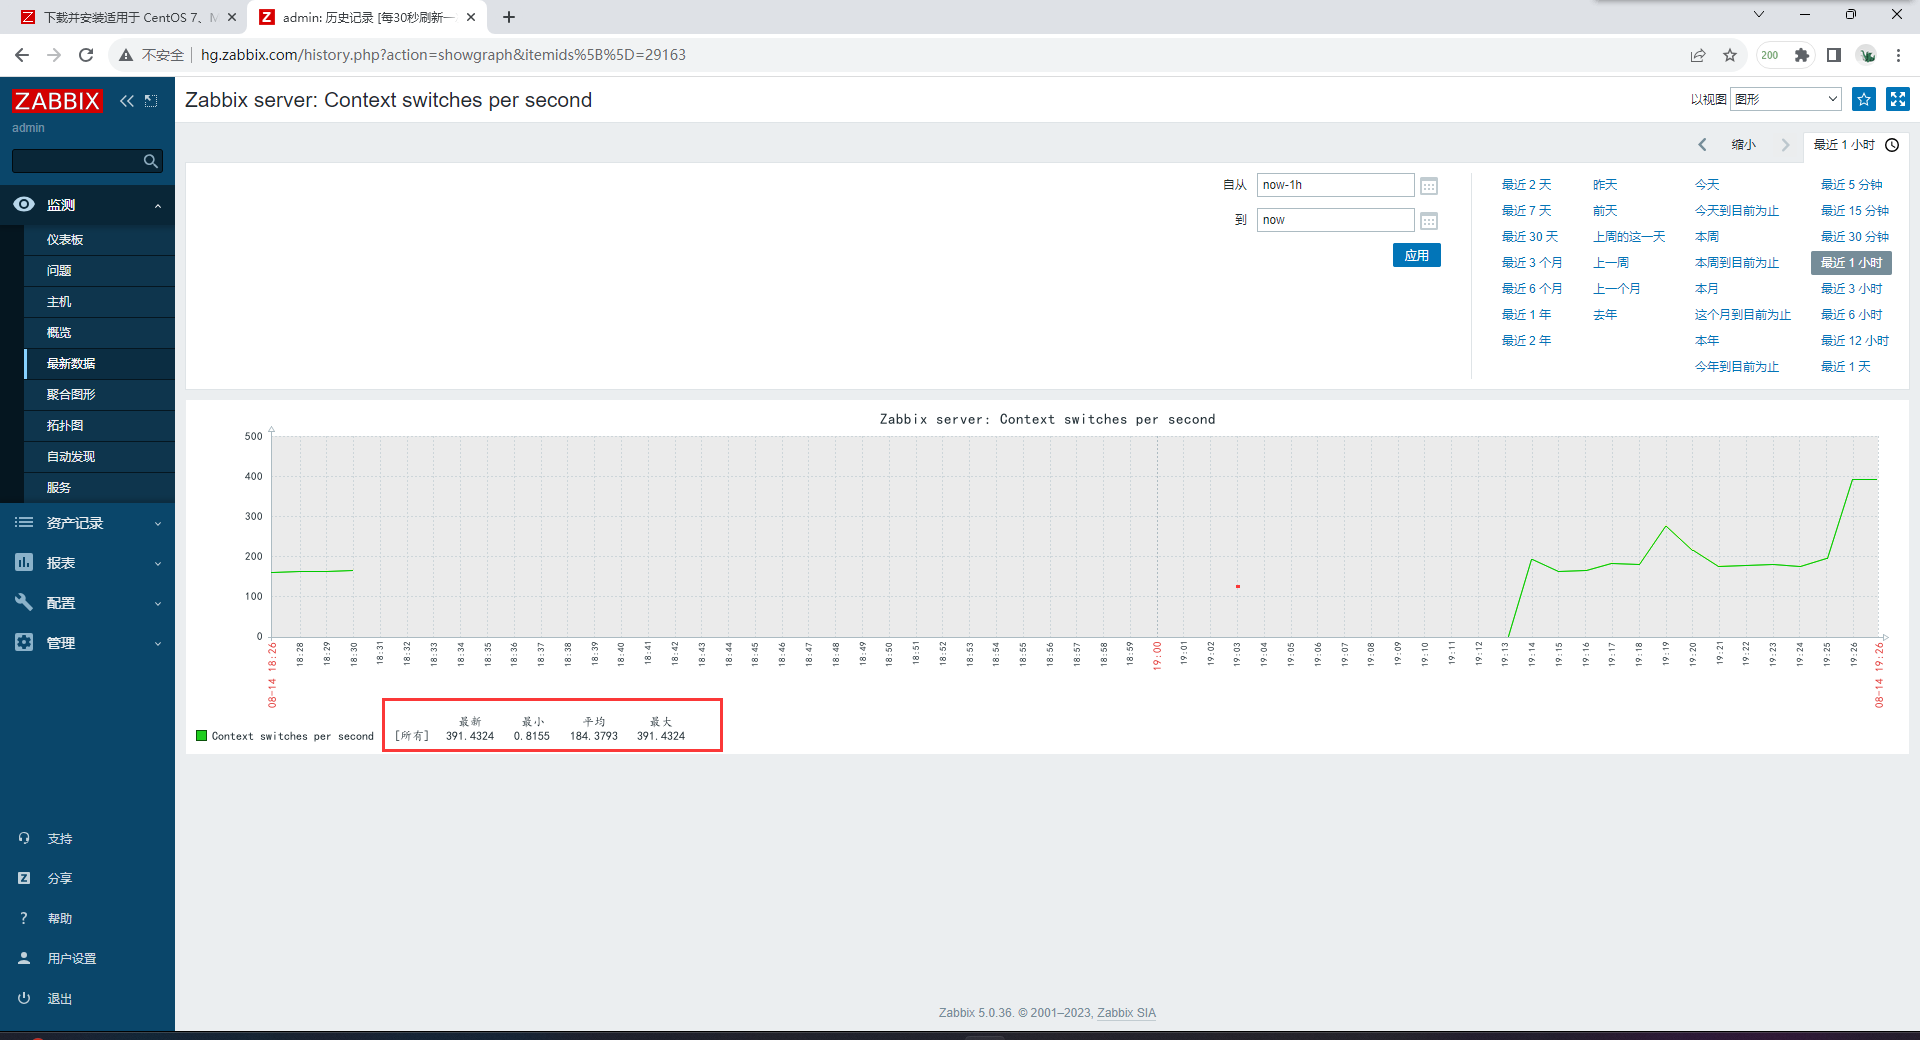
解决方法
在windows中找到中文字体
C:\Windows\Fonts

# 进入zabbix字体路径
[root@zabbix ~]# cd /usr/share/zabbix/assets/fonts/
[root@zabbix fonts]# ll
total 0
lrwxrwxrwx 1 root root 33 Aug 14 18:13 graphfont.ttf -> /etc/alternatives/zabbix-web-font

# 备份zabbix默认字体
[root@zabbix01 fonts]# mv graphfont.ttf graphfont.ttf.bak

# 上传C:\Windows\Fonts中想要的字体

# 给字体文件改变即可
[root@zabbix fonts]# mv SIMKAI.TTF graphfont.ttf
刷新页面
zabbix安装(3.0)
# 1.换源
[root@zabbix-server2 ~]# rpm -ivh https://mirrors.tuna.tsinghua.edu.cn/zabbix/zabbix/3.4/rhel/7/x86_64/zabbix-release-3.4-2.el7.noarch.rpm
# 2.安装server web agent mariadb
[root@zabbix-server2 ~]# yum -y install zabbix-server-mysql zabbix-web-mysql zabbix-agent mariadb
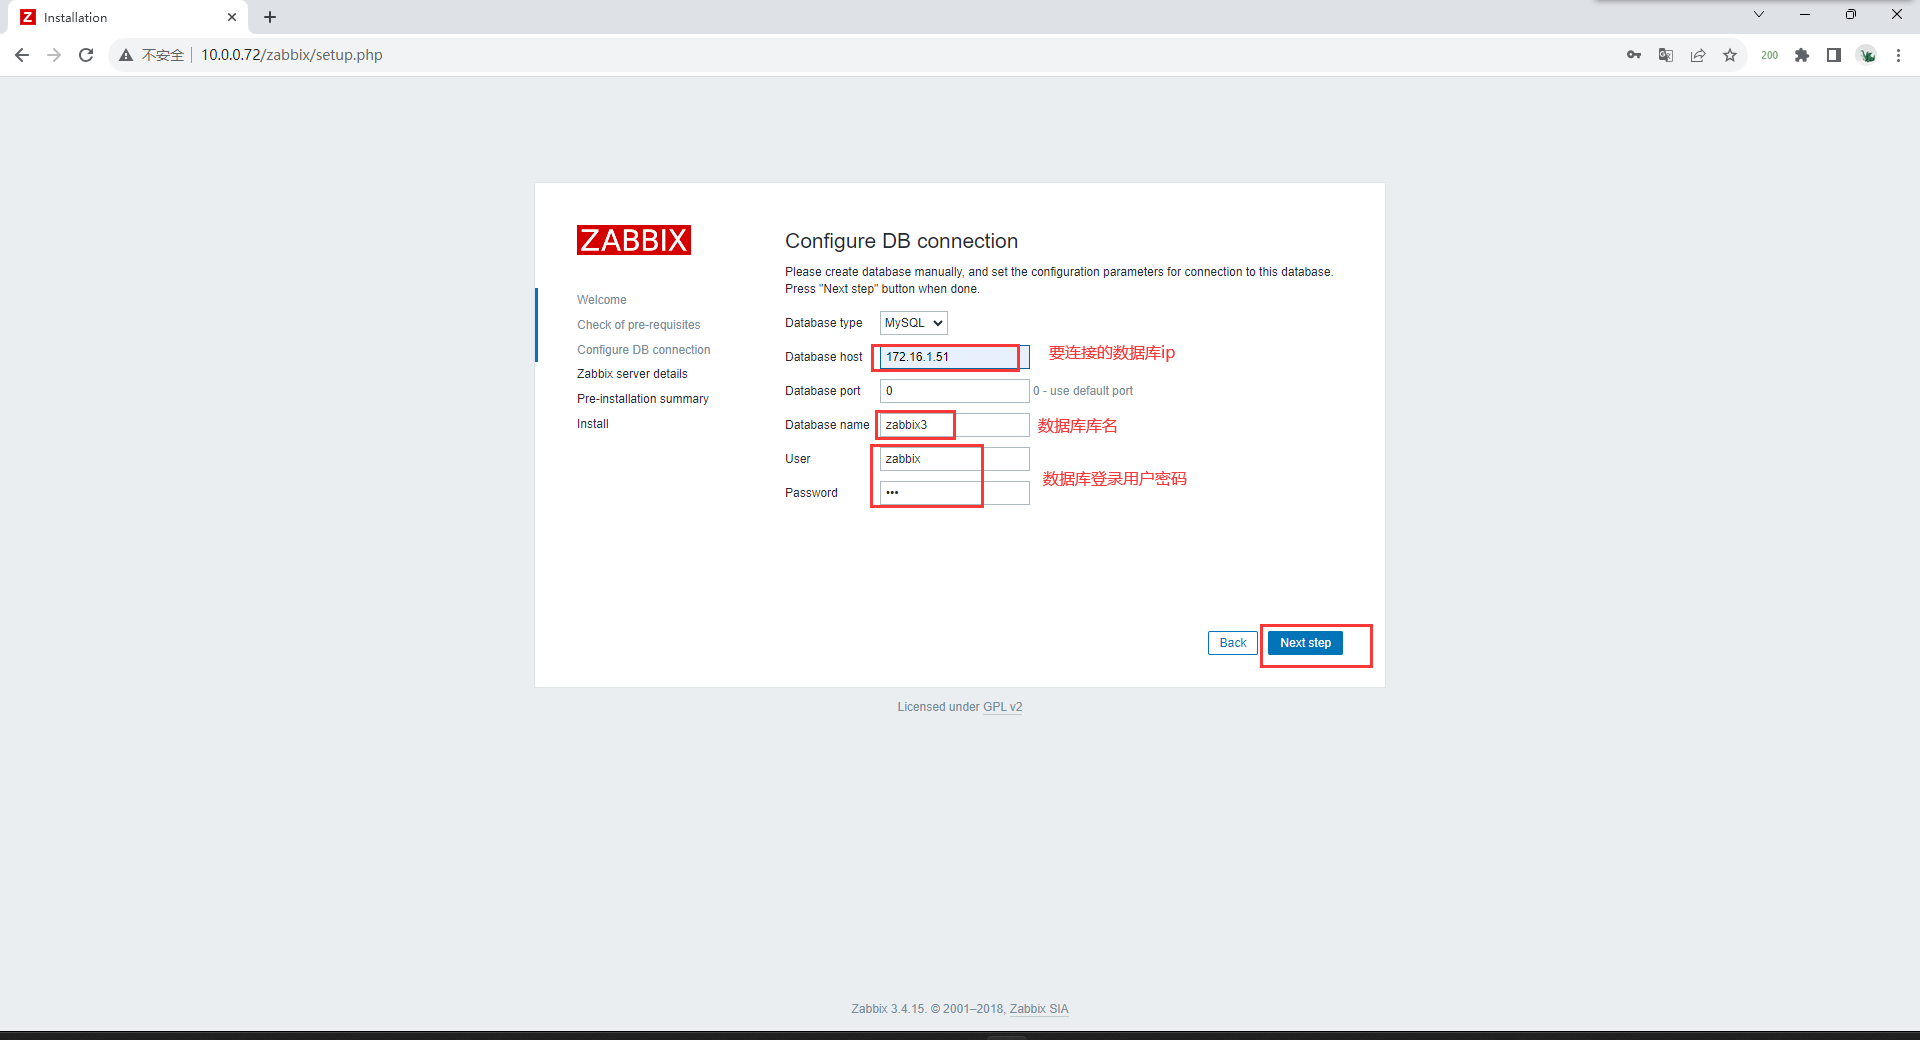
# 3.建库建用户
mysql> create database zabbix3 character set utf8 collate utf8_bin;
mysql> grant all on zabbix3.* to zabbix@'172.16.1.%' identified by '123';
# 4.导入sql数据
[root@zabbix-server2 ~]# zcat /usr/share/doc/zabbix-server-mysql*/create.sql.gz | mysql -uzabbix -p123 -h172.16.1.51 zabbix3
# 5.配置zabbix服务端
[root@zabbix-server2 ~]# vim /etc/zabbix/zabbix_server.conf
DBHost=172.16.1.51
DBName=zabbix3
DBUser=zabbix
DBPassword=123
# 6.修改时区
[root@zabbix-server2 ~]# vim /etc/httpd/conf.d/zabbix.conf
php_value date.timezone Asia/Shanghai ##删除注释
# 7.启动服务并加入开机自启
[root@zabbix-server2 ~]# systemctl start zabbix-server httpd zabbix-agent
[root@zabbix-server2 ~]# systemctl enable zabbix-server httpd zabbix-agent
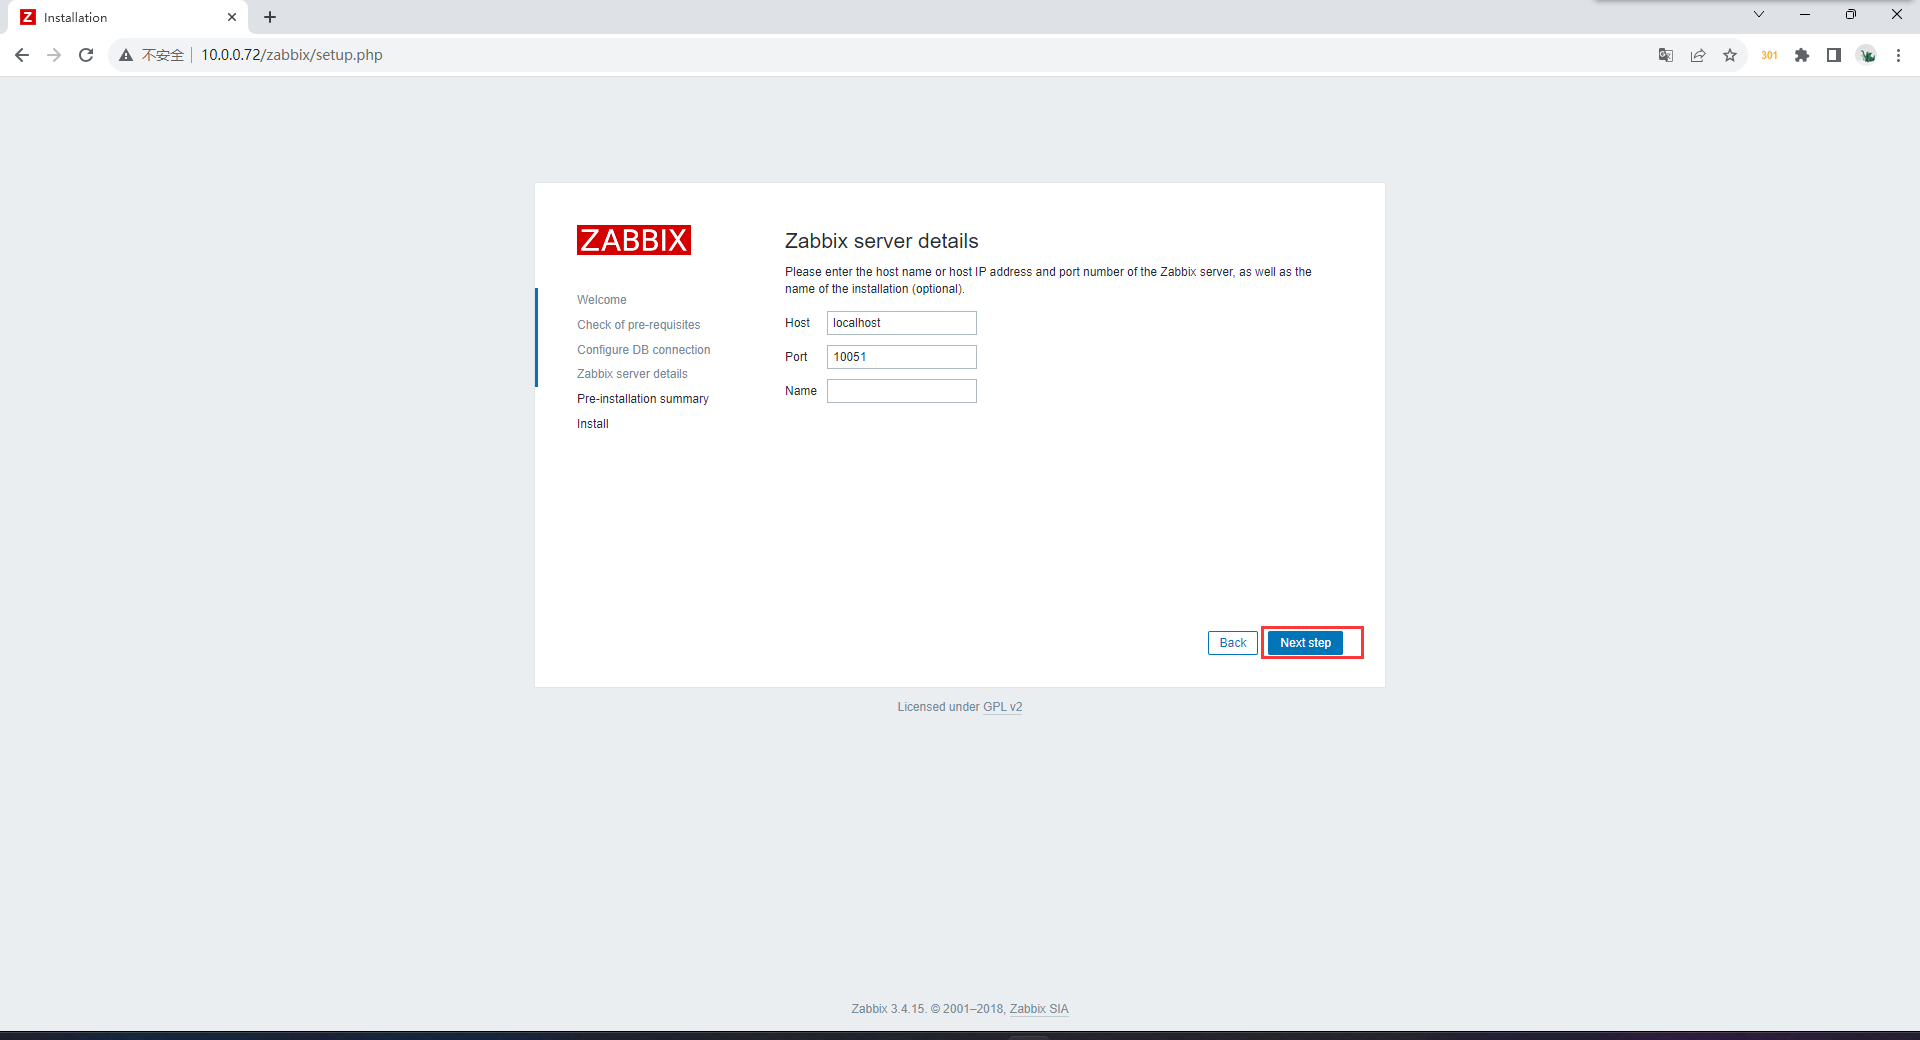
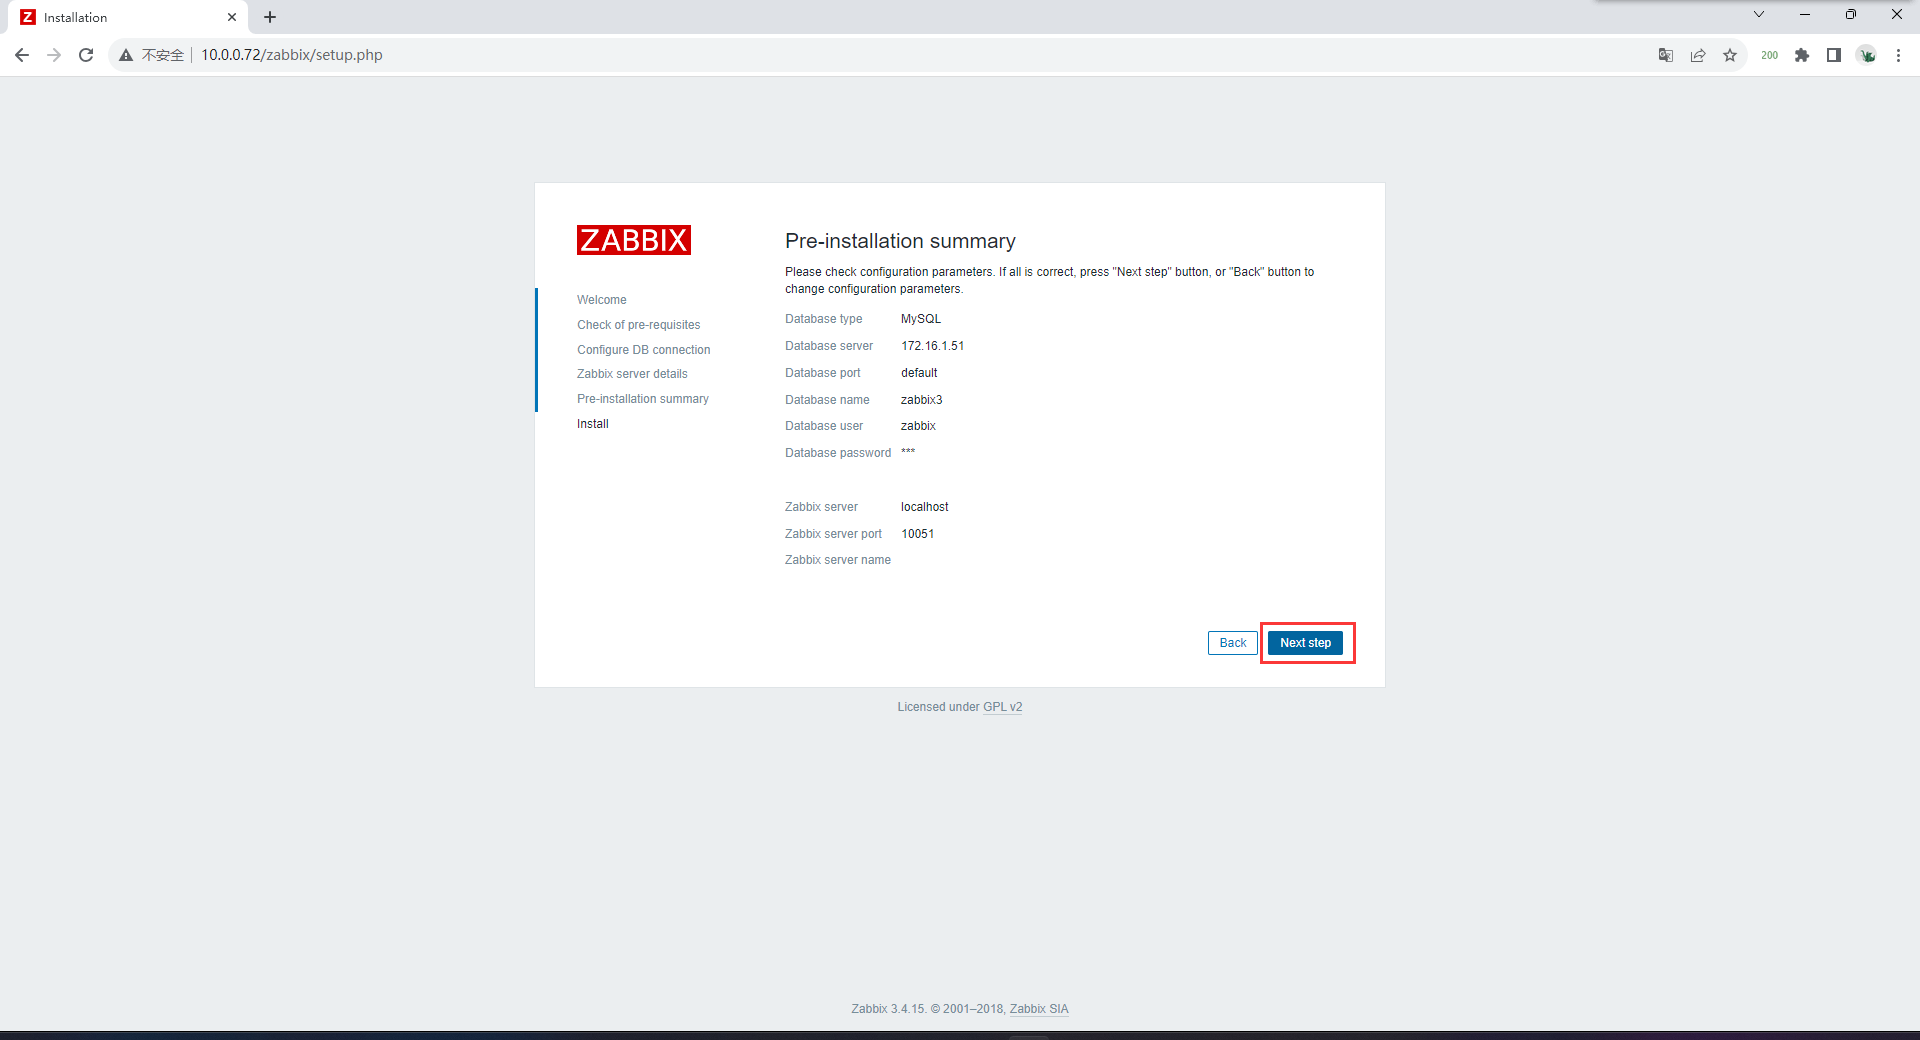
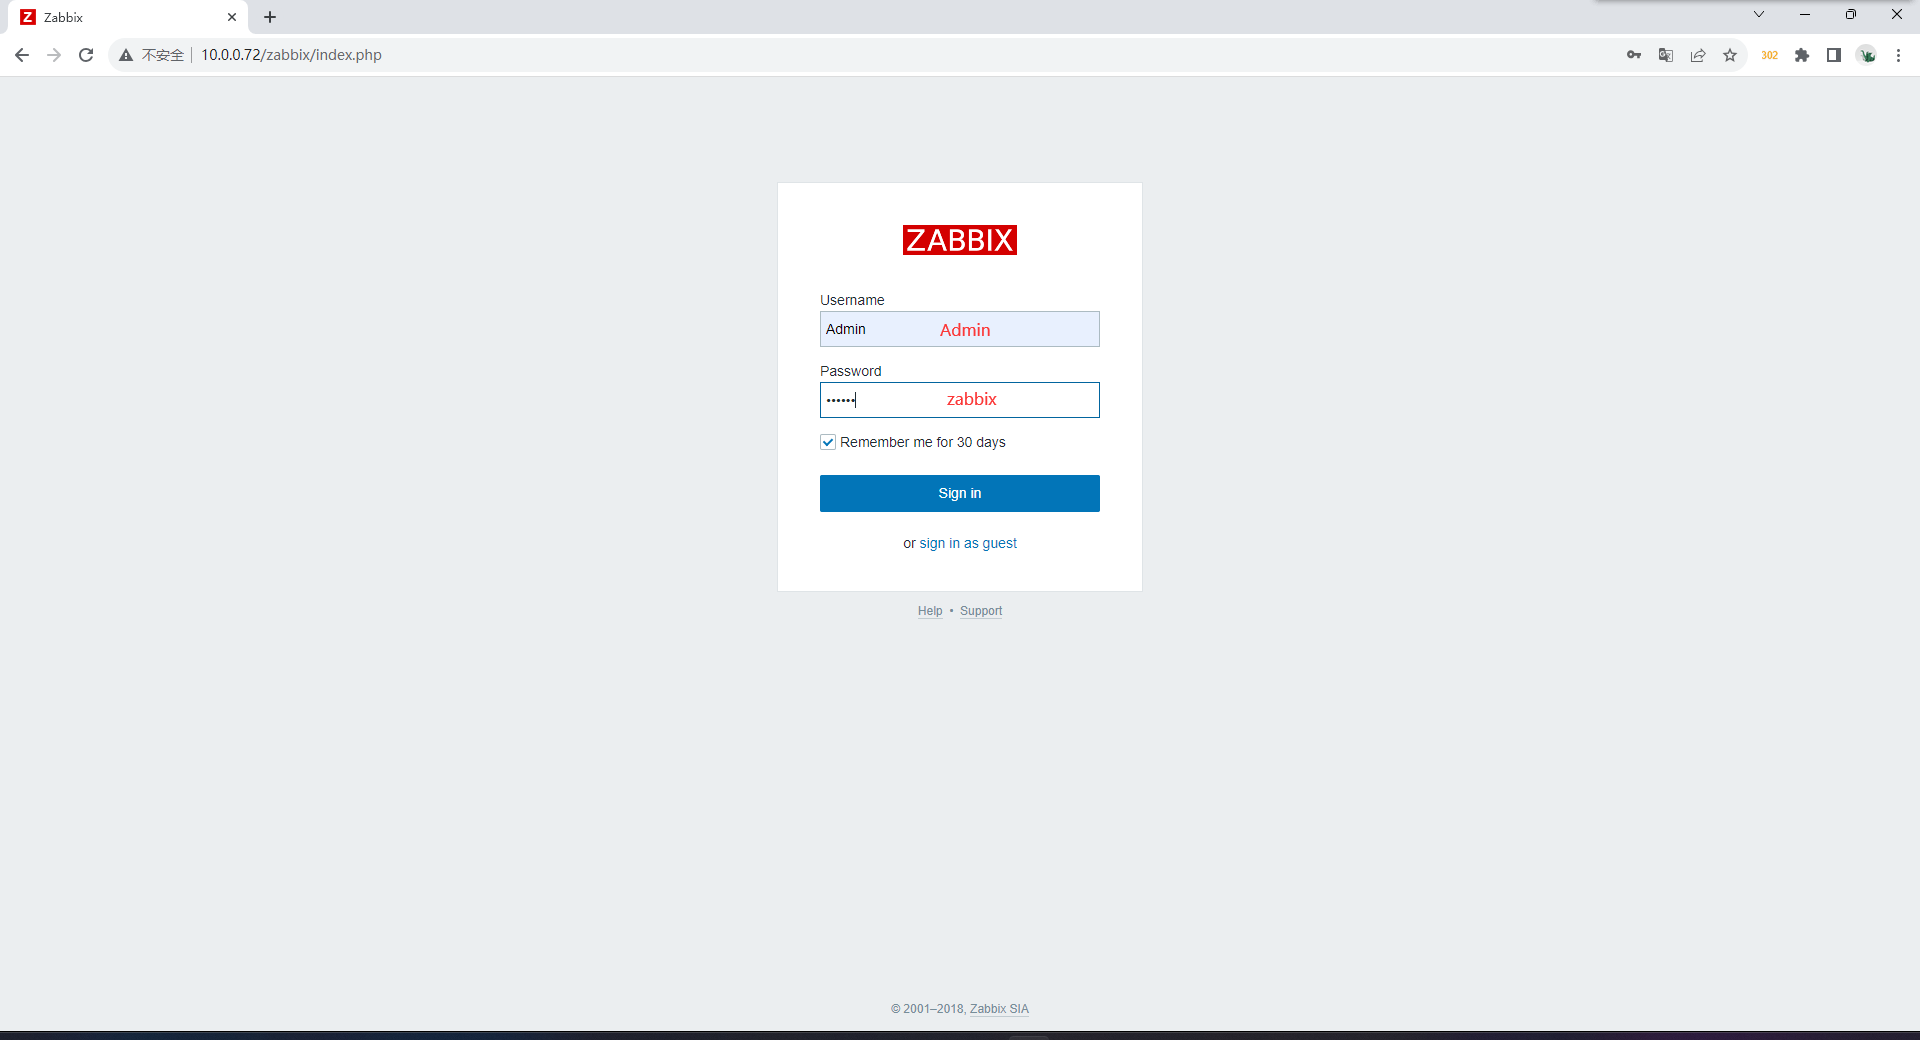
# 8.浏览器访问10.0.0.72/zabbix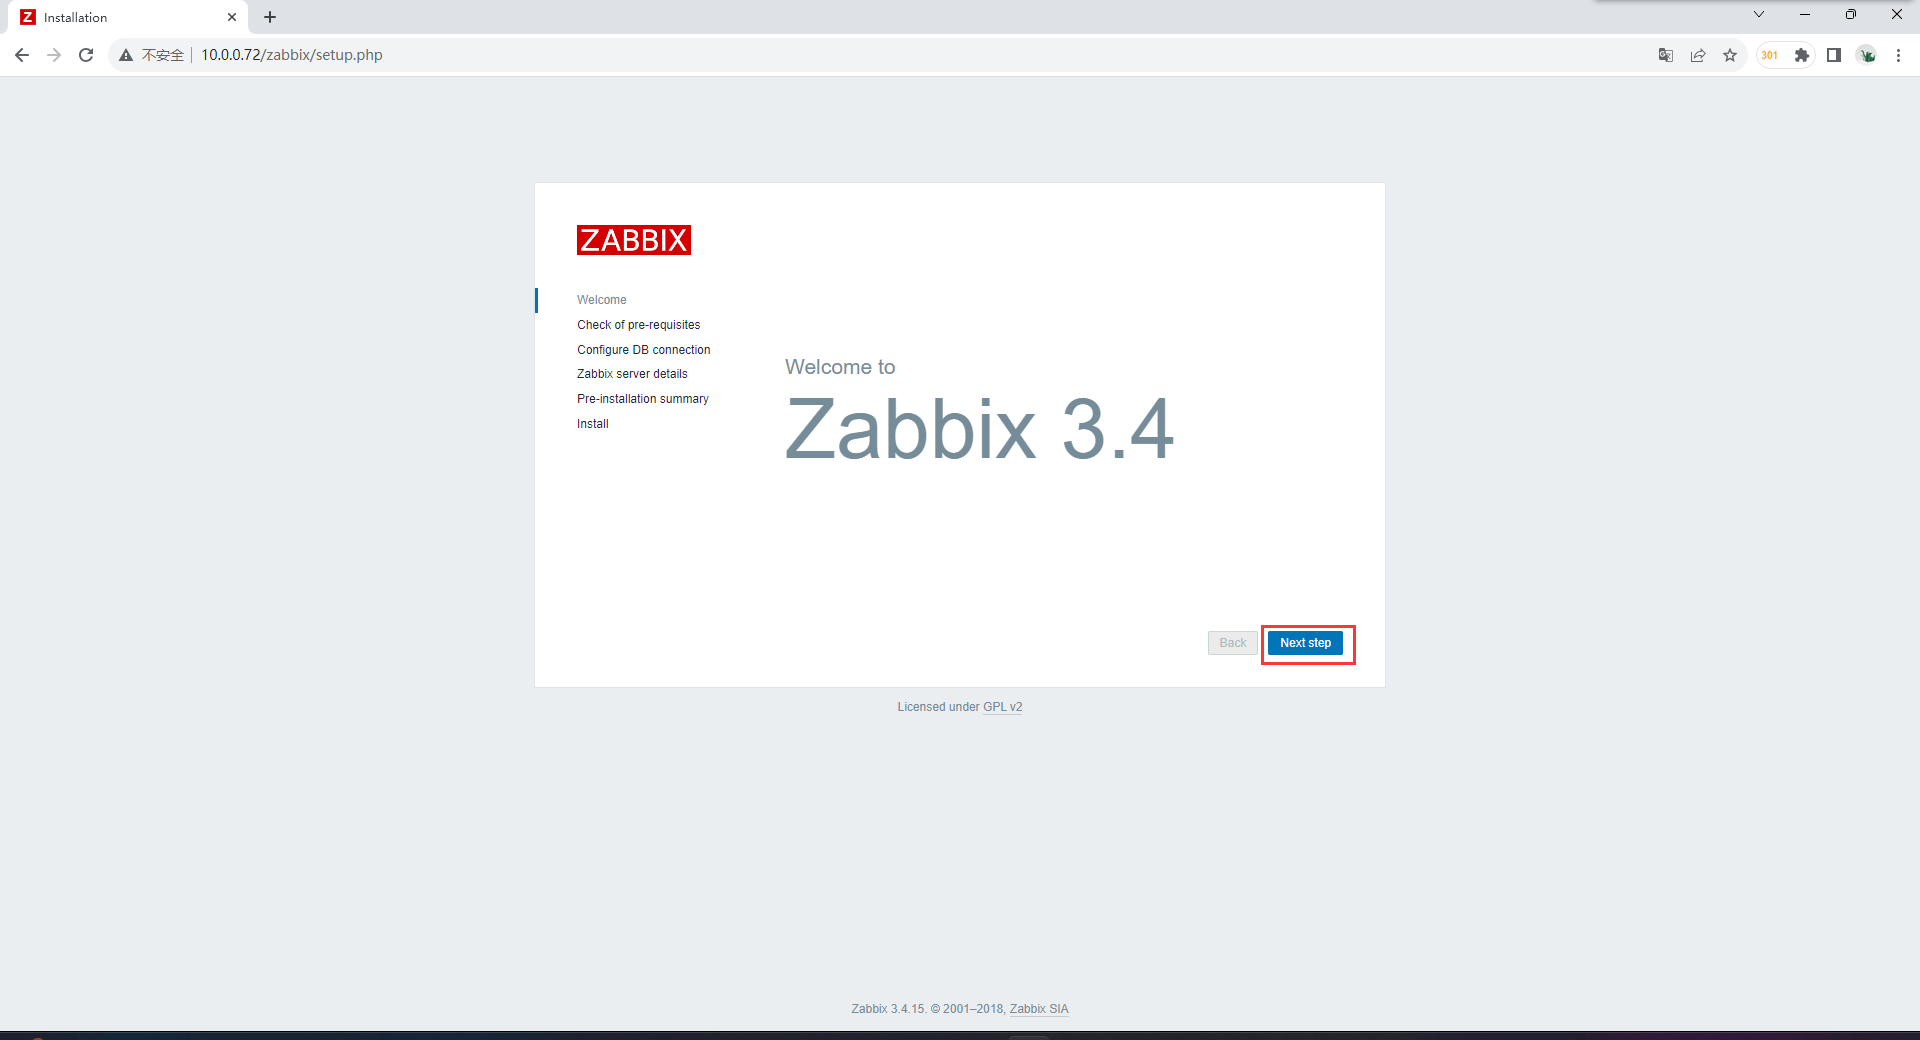
汉化


Comments | NOTHING